
Nvidia (NVDA) Chart Analysis As Earnings Loom
As we approach NVIDIA's highly anticipated earnings announcement on Wednesday, May 28th, 2025, the chart is painting a crystal-clear picture of what's at stake. After 26 years of analyzing markets, I can tell you that some setups are textbook – and NVIDIA right now is one of those rare moments where technical analysis becomes beautifully simple yet incredibly powerful.
The Setup: A Tale of Two Converging Forces
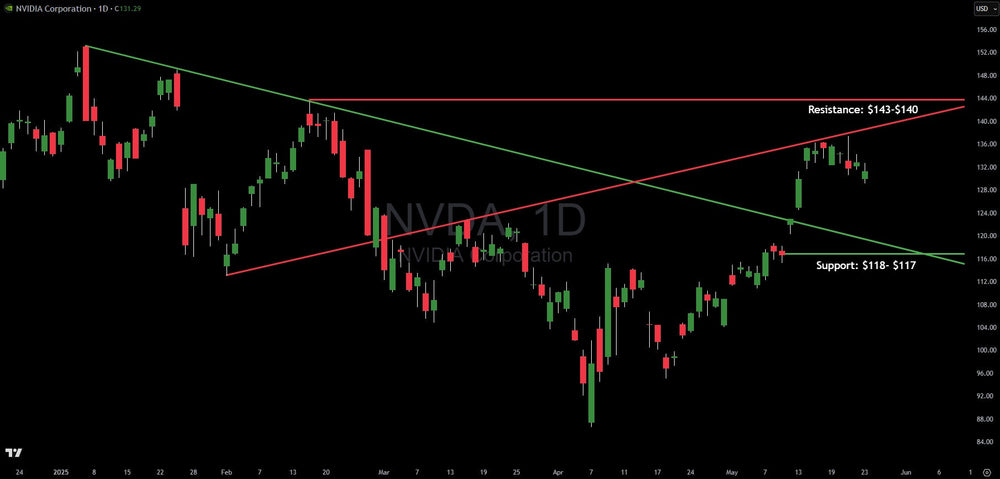
Looking at NVIDIA's daily chart, we're witnessing something that gets my technical analysis instincts firing on all cylinders. The stock is currently trading around $131, but here's what's fascinating – it's trapped between two converging zones that are about to force a decisive move.
On the upside, we have two red trendlines that are converging to form a formidable resistance zone between $143 and $140. Think of this as the ceiling that bulls need to crack through. On the downside, two green trendlines are converging to create a critical support foundation at $118 to $117 – essentially the floor that bears would need to break to gain meaningful control.
What strikes me about this setup is how these converging lines are creating what I call a "decision diamond" – a narrowing range that's squeezing price action toward an inevitable breakout. The closer we get to earnings, the tighter this coil becomes, and the more explosive the eventual move will be.
The Fundamental Backdrop: High Stakes, High Expectations
Now, let's talk about what Wall Street is expecting, because this earnings report isn't just another quarterly update – it's a potential catalyst that could determine NVIDIA's trajectory for months to come.
Analysts are forecasting revenue of $43 billion for NVIDIA's first quarter of fiscal 2026, representing a staggering 65% increase from the year-ago period. The consensus earnings per share estimate sits at $0.74, with a range between $0.64 and $0.93. What's particularly noteworthy is NVIDIA's track record – the company has beaten EPS estimates 100% of the time over the past 12 months. That's the kind of consistency that builds investor confidence and sets up potential positive surprises.
The analyst community remains overwhelmingly bullish, with 97 buy ratings versus just 7 holds and 1 sell. The average 12-month price target of $164.51 suggests significant upside potential from current levels, with some analysts setting targets as high as $200 to $220.
But here's where it gets really interesting from a technical perspective: several factors could drive results beyond these already optimistic expectations. Chinese companies like ByteDance, Alibaba, and Tencent reportedly placed orders worth at least $16 billion for NVIDIA's H20 AI GPUs in the first quarter alone. When you consider that NVIDIA's total China revenue in the previous fiscal year was just over $17 billion, these orders represent a potentially massive catalyst.
The Technical Picture: Pressure Building
From a pure chart reading standpoint, NVIDIA is exhibiting classic pre-earnings behavior. The converging trendlines I mentioned are creating what we technical analysts love to see – a compression pattern that typically precedes significant moves.
The beauty of this setup lies in its clarity. We have clearly defined battle lines. The resistance zone at $143-$140 represents where previous rallies have stalled, where sellers have consistently stepped in to cap advances. If earnings are strong enough to propel NVIDIA above this level, we're likely looking at a resumption of the broader uptrend with minimal overhead resistance until much higher levels.
Conversely, the support zone at $118-$117 has been built through multiple tests and represents where buyers have historically emerged. This level becomes critical because a break below it would signal that even the most committed NVIDIA bulls are throwing in the towel, potentially opening the door to much deeper selling.
The Psychology Behind the Setup
Here's where my experience reading market psychology becomes crucial. NVIDIA has become the poster child for the AI revolution, and with that comes both enormous opportunity and equally significant risk. The stock has attracted everyone from institutional investors to retail day traders, creating a diverse holder base with varying risk tolerances and time horizons.
The current consolidation between our key levels suggests the market is genuinely uncertain about what comes next. Short-term traders are likely positioning for the earnings volatility, while longer-term investors are weighing whether the current valuation – around 28 times forward earnings – adequately reflects the company's growth prospects.
This uncertainty creates the perfect environment for a significant move in either direction once we get clarity from the earnings report and guidance.
Potential Scenarios: What to Watch For
Bullish Scenario: If NVIDIA delivers results that exceed the already high expectations and provides strong forward guidance, a break above the $143-$140 resistance zone becomes highly probable. In this scenario, I'd expect to see strong volume confirmation and a quick move toward the $150-$155 area, with the potential to test all-time highs near $153.
The fundamental backdrop supports this scenario. Beyond the earnings themselves, NVIDIA continues to benefit from massive AI infrastructure investments, including projects like Stargate in the U.S., and the ongoing ramp-up of their Blackwell AI chip production.
Bearish Scenario: Conversely, if results disappoint or if guidance suggests slower growth ahead, the support zone at $118-$117 will be put to the ultimate test. A decisive break below this level could trigger significant selling pressure, potentially targeting the $100-$105 area where longer-term technical support resides.
The main risk to this setup comes from the $5.5 billion in additional costs NVIDIA expects to incur due to new licensing requirements from the Trump administration. If these costs weigh more heavily on margins than expected, it could provide the catalyst for a move lower.
Risk Management: The Key to Success
Here's where my 26 years of experience becomes invaluable for both traders and investors. Regardless of which scenario plays out, the key levels I've identified provide excellent reference points for risk management.
For those positioning bullishly ahead of earnings, using the $118-$117 support zone as a stop-loss level makes perfect sense from a risk-reward perspective. Similarly, for those betting on a potential disappointment, the $143-$140 resistance zone serves as a natural exit point if the trade goes against you.
What I particularly like about this setup is how clean the risk parameters are. You're not dealing with ambiguous levels or unclear technical signals. The converging trendlines create unambiguous zones that price must respect or break, giving traders and investors clear decision points.
The Bigger Picture: More Than Just One Quarter
While the immediate focus is on Wednesday's earnings, it's important to remember that NVIDIA's story extends far beyond any single quarterly report. The company sits at the epicenter of perhaps the most significant technological shift since the internet revolution.
The technical setup we're seeing now is playing out against this backdrop of fundamental transformation. Whether we break higher or lower in the near term, the longer-term growth trajectory for AI and NVIDIA's role in enabling it remains compelling.
From a technical perspective, even if we see a move lower toward the support zone, it could represent a buying opportunity for longer-term investors, provided that support level holds. Conversely, a break above resistance could signal the beginning of the next major leg higher in what has been an extraordinary multi-year bull run.
The Bottom Line
As we head into Wednesday's earnings announcement, NVIDIA presents one of the clearest technical setups I've seen in recent memory. The converging trendlines at $143-$140 resistance and $118-$117 support create a perfect storm for significant post-earnings volatility.
With analyst expectations running high and the fundamental backdrop remaining supportive, the odds may favor a break to the upside. However, markets have a way of humbling even the most confident predictions, which is why these clearly defined technical levels become so valuable for managing risk and maximizing opportunity.
Whether you're trading the setup or investing for the long term, keep your eyes on these key zones. They'll tell the story of NVIDIA's next chapter better than any analyst report or earnings call ever could. In the end, the chart doesn't lie – it simply reflects the collective wisdom and emotion of every participant in the market. And right now, that collective wisdom is poised to make a very big decision.
The stage is set, the levels are clear, and Wednesday's earnings will likely provide the catalyst that determines which way this AI giant moves next. As always, let the market show its hand first, then position accordingly. That's how you stay on the right side of the trade, regardless of which scenario ultimately unfolds.
This article is intended for informational and educational purposes only and does not constitute financial advice. All trading involves risk. Past performance is not indicative of future results. Trading involves substantial risk. All content is for educational purposes only and should not be considered financial advice or recommendations to buy or sell any asset.
Trading involves substantial risk. All content is for educational purposes only and should not be considered financial advice or recommendations to buy or sell any asset. Read full terms of service.


