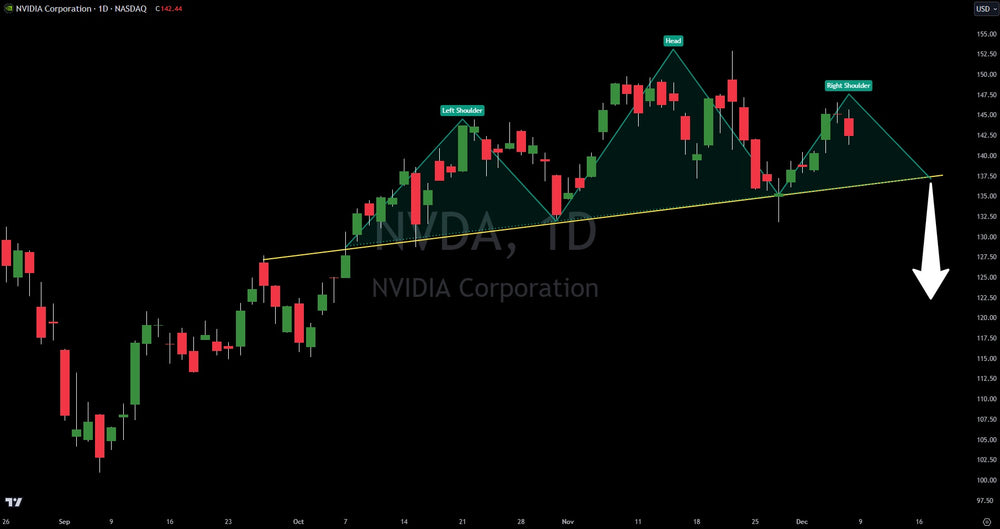
Nvidia (NVDA) Head And Shoulder Pattern Signals Trouble

Nvidia (NVDA), once the darling of the tech rally and a driving force behind the broader market's ascent, is now flashing warning signs. While the NASDAQ and S&P 500 continue to reach new heights, Nvidia has notably lagged behind, diverging from the bullish trend.
This divergence is particularly concerning given the ominous technical pattern forming on Nvidia's chart: a head and shoulders pattern. This classic bearish formation suggests a potential reversal is looming. Should the neckline at $137 break, Nvidia could be vulnerable to a significant decline, with a target of $100 in sight.
While momentum and greed continue to propel the broader market higher, investors would be wise to heed the warning signals emanating from Nvidia. This former market leader may be foreshadowing a broader market correction, reminding us that even in the most exuberant bull markets, caution is warranted.
Trading involves substantial risk. All content is for educational purposes only and should not be considered financial advice or recommendations to buy or sell any asset. Read full terms of service.


