Nvidia's Neckline Retest Leads 5 Stock Charts at Decision Points
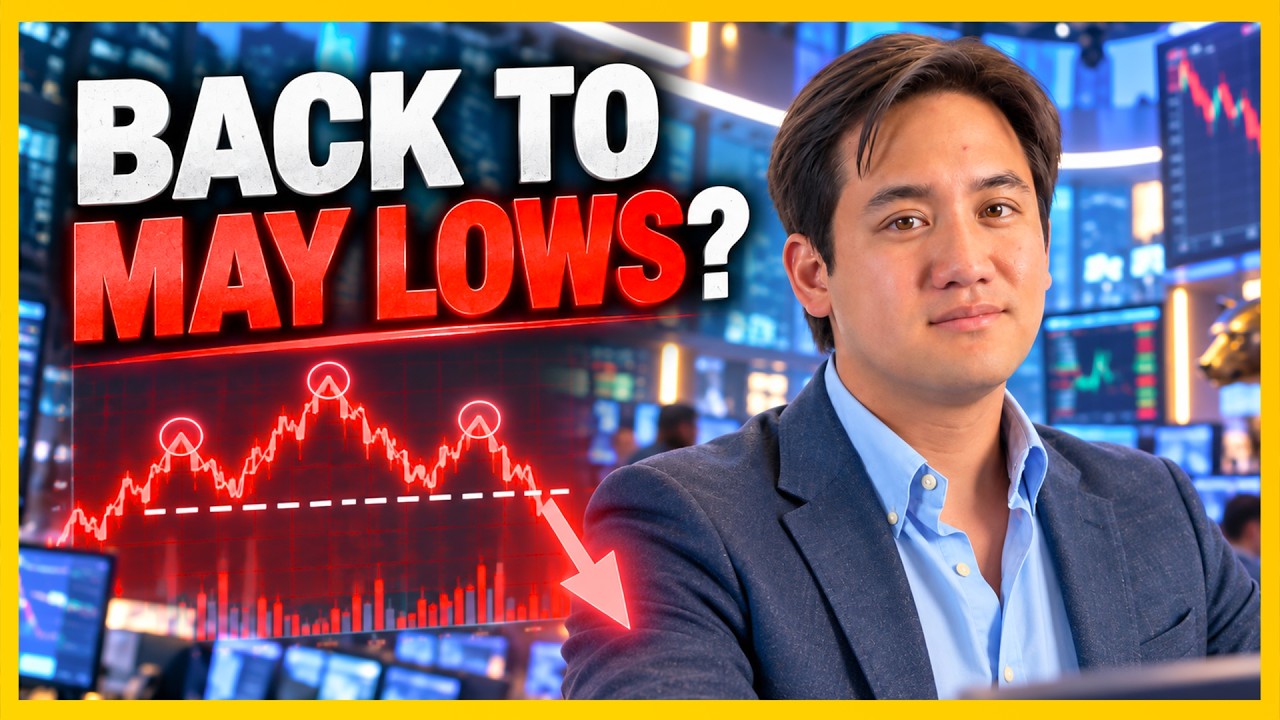
Five mega-cap names are sitting at genuine decision points right now, and the clearest is Nvidia, where price has spent the past several sessions retesting the exact neckline it broke down from during a head-and-shoulders top. The next daily close does real work: it either negates the pattern or confirms the breakdown still has room to run.
The other four round out a picture of a market working through fresh catalysts and older technical structure at once. SpaceX trades against its own IPO framework just as a major product launch hits the news cycle. Microsoft pushes into a gap left behind by an earlier breakout. Arm and Micron work through their own support and resistance tests. These are conditional reads, not forecasts, each with a defined condition for what confirms it and what invalidates it.
Nvidia: A Head-and-Shoulders Pattern at the Retest
Nvidia's chart shows a textbook head-and-shoulders top, complete with a clean break of the neckline that produced a continuation move lower. Price has since worked back up into that neckline, the level that decides everything: a daily close back above it, followed by continuation, negates the pattern; a rejection keeps it intact.
The level that matters most on the way up is $218.66, where a 61.8% Fibonacci extension lines up with a cluster of prior resistance. A daily close above that zone would call the bearish read into question and shift focus toward Nvidia's all-time high. Reject there instead, and the setup points back toward the $165.21 area on the downside.
SpaceX: A Support Test Against the IPO, With a Launch in Play
SpaceX's key reference levels come from the IPO itself rather than a long price history. Reuters reported that the company priced its IPO at a fixed $135 per share and merged with Elon Musk's xAI business in February, the deal that folded the Grok AI platform into SpaceX's public story alongside Starlink and its launch operations. The stock has traded above that $135 IPO price since debut, even as it currently sits below its post-IPO opening trade, and a Grok-related product rollout is now hitting the news cycle within that framework, the kind of setup where a headline can move price quickly against an already-drawn technical line.
The nearer-term support is the recent low, below the opening pivot. The more significant level underneath is the $135 IPO price itself, a zone where broader participation would plausibly show up on further weakness. A daily close below that level would suggest the launch is being treated as a sell-the-news event; holding above it keeps the constructive read intact.
Microsoft: Reclaiming a Trendline, Testing the Next Gap
Microsoft's chart shows repeated tests against a downsloping trendline, an eventual breakout, a pullback below it, a consolidation, and a fresh push higher. That old trendline resistance, now support, lines up with a pivot low near $356.42, the level that confirmed the current move.
With that support holding, the next level worth tracking is a gap near $399.94, an area likely to draw an initial rejection given the low pivots just above it. A daily close above that zone puts a 61.8% Fibonacci extension near $421.58 into focus, reinforced by a nearby gap. A daily close back below $356.42 would call the recent bullish structure into question.
Arm and Micron: Two Setups Lower on the Watchlist
Arm's daily chart is starting to show oversold conditions even as the broader structure stays more bearish. First support sits at $288.31; a daily close below opens a gap down to $256.73, with a secondary support band near $237.68 backed by a wide-range, high-volume candle. Each level marks a progressively deeper zone rather than a single line in the sand.
Micron's setup centers on a gap that has already filled: price ran roughly 40% off the $891.88 gap-close level before pulling back into that same gap, evidence buyers active there remain engaged. The nearer-term level worth tracking is $984.75, a spot likely to draw a short-term reaction. The level that matters most above that is the all-time high near $1,256.98: it's the resistance that needs to hold for this to stay a resistance zone, and a daily close above it would negate that read and clear the way for further upside instead. Fibonacci extensions near $1,116.20 and $1,213.58 sit in between as secondary markers on the way up.
Key Levels to Monitor
| Asset | Level | Significance |
|---|---|---|
| Nvidia (NVDA) | Neckline (current retest zone) | Reclaim plus continuation needed to negate head-and-shoulders top |
| Nvidia (NVDA) | $218.66 | 61.8% Fib extension / resistance confluence |
| Nvidia (NVDA) | $189.71 / $165.21 | Secondary downside targets if neckline holds as resistance |
| SpaceX (SPCX) | Recent low (~$145.62) | Near-term support below the IPO opening trade |
| SpaceX (SPCX) | $135.00 | Original IPO price, broader support zone |
| Microsoft (MSFT) | $356.42 | Trendline-turned-support confirming the current move |
| Microsoft (MSFT) | $399.94 / $421.58 | Gap resistance / 61.8% Fib extension |
| Arm (ARM) | $288.31 / $256.73 / $237.68 | Layered support levels on further weakness |
| Micron (MU) | $984.75 | Near-term level for a potential short-term reaction |
| Micron (MU) | $1,116.20 / $1,213.58 | Secondary Fib extension markers on the way up |
| Micron (MU) | $1,256.98 (all-time high) | Key resistance; a daily close above it negates the resistance read and favors further upside |
What to Watch Next
Nvidia's neckline retest matters most this week: a daily close back above it followed by continuation negates the head-and-shoulders top, while a rejection keeps the downside targets in the table in play. SpaceX's reaction to the Grok rollout, measured against the $135 IPO price rather than the recent low, will say a lot about how the market is pricing the AI side of the business post-merger. Microsoft holding $356.42 while working toward the $399.94 gap is the near-term tell on that chart, and Arm's response at $288.31 determines whether the deeper support levels come into play at all.
Process Over Prediction
None of these five setups is a forecast. Each is a probability read built from observable structure: necklines, gaps, trendlines, and Fibonacci confluence, with a defined condition for what confirms the thesis and what invalidates it. Nvidia's retest carries the highest conviction because it stacks multiple factors at one price zone, but the same discipline applies across all five: wait for the daily close, respect the level that negates the idea, and treat every chart as a conditional read, not a certainty.
This article is intended for informational and educational purposes only and does not constitute financial advice. All trading involves risk. Past performance is not indicative of future results. Trading involves substantial risk. All content is for educational purposes only and should not be considered financial advice or recommendations to buy or sell any asset.
Trading involves substantial risk. All content is for educational purposes only and should not be considered financial advice or recommendations to buy or sell any asset. Read full terms of service.