Nvidia (NVDA): Key Technical Chart Support Levels

Shares of Nvidia (NVDA) tumbled 14% in the latest week as worries over a slowdown in AI spending and valuation concerns took hold. Nvidia now finds itself down 27% from all-time highs while other AI stocks like Super Micro Computer are down nearly 70% from their highs.
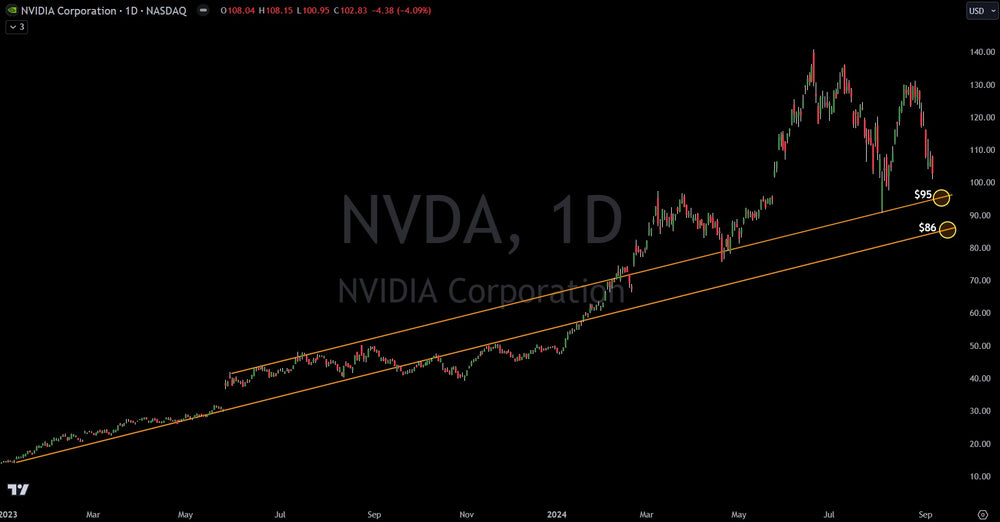
Based on pure technical analysis using trend lines, Nvidia likely is still headed lower in the near-term and long-term. Of course, bounces will happen, but the first major technical support on the chart is at $95. When that breaks, the next level is $86. Note the two trend lines in the chart above. These are near-term supports as price is likely headed far lower. The key levels are revealed below.
Historically, the unwind process of these type of mega moves can cause stocks to fall as much as 75%. Tesla (TSLA) was a good example in in 2021, as well as Cisco Systems (CSCO) in 2001, following the Dot-com bubble. Having said that, there will be plenty of trading opportunities in Nvidia with mega bounces along the way.
Some of the bigger swing trade levels would be down around the $67.50 level and $50 level. Most would laugh at these levels being seen again on Nvidia, but they thought the same on Tesla in 2021 before it dropped 75%. Just remember, margins contract, competition comes in and investor fear takes over. This can cause over-reactions to the downside just like the upside.
Trading involves substantial risk. All content is for educational purposes only and should not be considered financial advice or recommendations to buy or sell any asset. Read full terms of service.


