
S&P 500 Rising Wedge Breakdown: Cycle Analysis Points to Further Decline
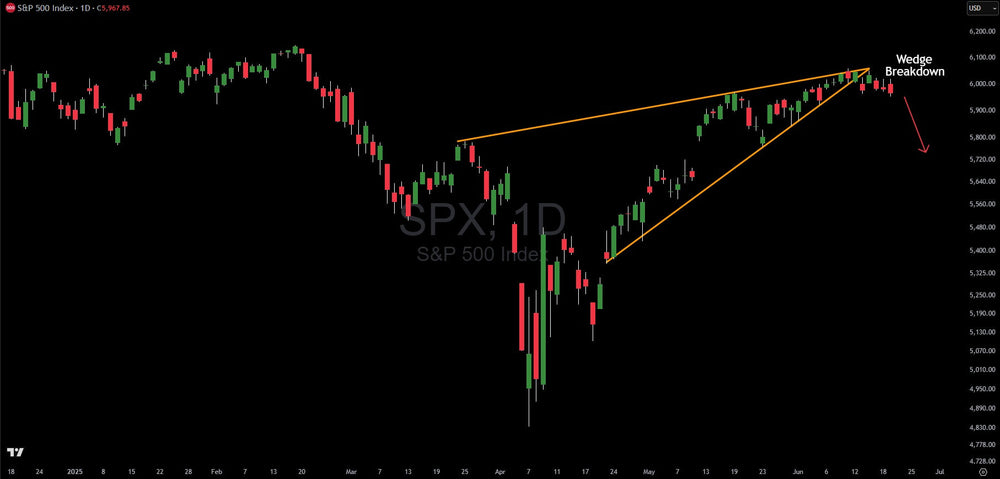
The S&P 500's recent price action has delivered exactly what technical analysis and cycle work suggested it would – a breakdown from a textbook rising wedge pattern that formed over the past several weeks. Currently trading around 5,967, the index has broken below the lower boundary of this bearish continuation pattern, setting the stage for what could be a significant move lower.
As someone who's been tracking market cycles for over two decades, I alerted Verified Investing members and viewers of my Game Plan YouTube show to watch for a potential turning point in mid-June – and I did this as much as a month in advance. The timing wasn't arbitrary; it was based on cycle analysis that pointed to this exact window as a high-probability reversal zone. The fact that the wedge breakdown occurred precisely during this forecasted period validates both the technical pattern and the underlying cycle work.
Understanding the Rising Wedge: A Bearish Warning Signal
A rising wedge is one of those chart patterns that often catches traders off guard, particularly those who mistake it for bullish continuation. The pattern forms when price makes higher highs and higher lows, but here's the key: the rate of ascent slows dramatically as both the upper and lower trend lines converge. Think of it like a runner who starts strong but gradually loses steam – the forward progress continues, but with diminishing momentum.
What makes a rising wedge particularly deceptive is that it appears bullish on the surface. After all, price is still making new highs, right? But look closer at the internal structure, and you'll notice something troubling: each successive high requires more effort to achieve, while the pullbacks become shallower and more frequent. Volume typically decreases during the formation, signaling that fewer market participants are willing to chase prices higher at these elevated levels.
The S&P 500's recent wedge exemplified these characteristics perfectly. From the April lows around 5,000, the index initially surged with conviction, but as it approached the 6,000 level, the upward momentum began to wane. The converging trend lines created a pressure cooker effect, with bulls and bears locked in an increasingly tight battle for control.
Cycle Analysis: Nature's Hidden Market Timer
My cycle work pointed to mid-June as a potential inflection point, and this timing alignment with the wedge breakdown wasn't coincidental – it was the result of understanding how natural rhythms influence market behavior. Cycles exist everywhere in nature, from the 24-hour circadian rhythm that governs our sleep patterns to the lunar cycles that affect ocean tides. These same rhythmic patterns manifest in financial markets, creating predictable windows of opportunity for those who know how to recognize them.
Human psychology itself operates on cyclical patterns. We experience periods of optimism followed by pessimism, confidence followed by doubt, greed followed by fear. These emotional cycles aggregate into collective market behavior, creating the boom-and-bust patterns we've observed throughout financial history. Markets don't move in straight lines precisely because human nature doesn't operate in straight lines.
The mid-June cycle date I identified represented a convergence of several different time cycles – some short-term, others intermediate-term. When multiple cycles align, they create what I call a "cycle cluster," which often coincides with significant market turning points. The fact that this cluster coincided with the completion of the rising wedge pattern provided a powerful one-two punch for bears.
Think about your own daily rhythm: you don't maintain the same energy level throughout the day. You have peaks and valleys, periods of high activity and times when you naturally slow down. Markets exhibit this same behavior on various time scales, and successful traders learn to align their strategies with these natural ebbs and flows.
The Breakdown: When Technical Meets Temporal
The wedge breakdown occurred with the kind of precision that demonstrates why combining technical analysis with cycle work can be so powerful. As mid-June arrived, the S&P 500 finally succumbed to the building pressure within the wedge formation. Price broke decisively below the lower trend line, confirming what the pattern structure had been suggesting for weeks.
This breakdown represents more than just a technical failure – it signals a fundamental shift in market character. The bulls who drove the rally from April's lows have exhausted their buying power at these elevated levels. Meanwhile, bears are beginning to assert themselves, recognizing that the risk-reward equation has shifted dramatically in their favor.
Volume patterns during the breakdown provide additional confirmation. While volume was relatively light during the wedge formation (typical for these patterns), the selling pressure increased noticeably as price violated the lower boundary. This suggests that the breakdown has substance behind it, rather than being a false signal.
Psychology of the Wedge: When Optimism Meets Reality
From a psychological standpoint, rising wedges represent the final stage of a trend where hope overtakes reason. Market participants become so accustomed to "buying the dip" that they continue purchasing even as the underlying momentum deteriorates. Each bounce becomes weaker, each rally more labored, but the conditioning from previous successful dip-buying experiences keeps the optimism alive.
The breakdown phase brings a harsh reality check. Suddenly, the strategy that worked so well during the early stages of the trend begins failing. Stop losses get triggered, margin calls force additional selling, and the psychology shifts from "buy the dip" to "sell the rally." This psychological reversal often leads to accelerated selling as participants rush for the exits.
This psychological shift is already becoming evident in market sentiment indicators and sector rotation patterns. The broad-based strength that characterized the April-to-June rally has given way to more defensive positioning. Technology stocks, which led the advance, are showing signs of fatigue, while defensive sectors are beginning to attract attention.
Implications and Outlook: Preparing for Further Weakness
Based on both the technical breakdown and cycle analysis, I expect the S&P 500 to experience additional downside pressure in the coming weeks. The rising wedge pattern typically projects a decline equal to the height of the formation, which could take the index back toward the 5,400-5,500 area – roughly a 10% correction from current levels.
More importantly, this breakdown occurs against a backdrop of several market vulnerabilities that could amplify the decline. Interest rate uncertainty continues to weigh on valuations, while corporate earnings growth is showing signs of deceleration. Geopolitical tensions remain elevated, and seasonal patterns historically show increased volatility during the summer months.
The cycle work suggests that this weakness could extend well into the third quarter, with the next major inflection point potentially arriving in early fall. This doesn't mean straight-line selling – markets rarely cooperate by moving in perfect trends – but rather that the overall bias has shifted from bullish to bearish.
For investors positioned in growth-oriented strategies, this environment calls for increased defensive measures. Consider reducing exposure to high-beta names that tend to amplify market movements, and focus on quality companies with strong balance sheets and consistent cash flows. This isn't the time for heroic buying of speculative positions.
The Natural Foundation of Market Cycles
Understanding cycles requires recognizing that they permeate every aspect of the natural world around us. The seasons progress through predictable phases marked by temperature changes, daylight variations, and cascading effects through ecosystems as plants and animals respond to changing light, temperature, and moisture conditions. Spring triggers snow melt and new growth, summer brings peak energy and activity, autumn signals harvest and preparation, while winter enforces dormancy and conservation.
The sun itself operates on an 11-year solar cycle, with sunspot activity fluctuating from minimum to maximum in predictable patterns that have been observed for centuries. These solar cycles affect weather patterns, electromagnetic radiation levels, and even influence human physiology and behavior patterns. During sunspot peaks, increased solar radiation affects Earth's population of living organisms, with studies showing measurable biological and behavioral effects.
The moon creates some of nature's most powerful cycles through its 29.5-day lunar cycle, driving not only ocean tides but also affecting animal behavior, migration patterns, and reproductive cycles. Birds time their migrations to lunar phases, nocturnal animals adjust their foraging patterns to moonlight intensity, and marine creatures coordinate spawning events with specific moon phases. The Great Barrier Reef's mass spawning occurs annually just after the full moon, creating a spectacle visible from space.
Tidal cycles create twice-daily rhythms as gravitational forces from both the moon and sun combine to produce spring and neap tides every two weeks. These tidal patterns influence intertidal organisms so profoundly that their biological rhythms occur in multiples of tidal periods, with effects that extend even to vertebrates. Animals employ diverse survival strategies tied to these cycles – bears hibernating during winter months, birds migrating along established flyways, and desert creatures timing their emergence with seasonal rains.
What makes these natural cycles relevant to market analysis is their profound influence on human behavior. We are not separate from nature's rhythms – we are part of them. Human circadian rhythms respond to daily light cycles, while longer-term patterns may be influenced by lunar and seasonal variations. Research has shown that sunspot cycles correlate with historical periods of "mass excitement" including wars, migrations, and social upheavals, with 60% of such events clustering around sunspot peaks.
Individual humans might experience only subtle influences from these cosmic rhythms, but markets aggregate the behavior of millions of participants. When even a small percentage of investors feel slightly more optimistic during certain lunar phases, or experience marginal mood changes during seasonal transitions, or respond unconsciously to solar radiation variations, these tiny individual effects compound dramatically across the entire market ecosystem.
Consider this mathematical reality: if a natural cycle influences just 2% of market participants by making them 5% more likely to buy or sell during certain periods, the cumulative effect across millions of traders can create measurable price movements. These influences don't operate through conscious decision-making – they work through the same biological mechanisms that govern sleep patterns, hormone cycles, and mood fluctuations that have been hardwired into human physiology over millions of years of evolution.
The mid-June cycle date that I identified operates within this broader framework of natural rhythms. Market participants, whether they realize it or not, are subject to the same forces that govern tidal movements, animal migrations, and seasonal changes. When technical analysis aligns with these deeper rhythmic patterns, as happened with the S&P 500's wedge breakdown, the resulting moves often exceed what pure chart analysis might suggest.
This article is intended for informational and educational purposes only and does not constitute financial advice. All trading involves risk. Past performance is not indicative of future results. Trading involves substantial risk. All content is for educational purposes only and should not be considered financial advice or recommendations to buy or sell any asset.
Trading involves substantial risk. All content is for educational purposes only and should not be considered financial advice or recommendations to buy or sell any asset. Read full terms of service.


