
S&P 500 Technical Analysis: Institutional Chart Analysis
There is no shortage of bullish investors. Stocks continue to go higher, no matter the negative news. Whether it is an abundance of liquidity, AI chip craze, government debt spending or the Federal Reserve, markets have made almost 50 new all-time highs this year alone.
When analyzing the chart of the S&P 500, it appears there may be a little more upside left before a technical analysis sell signal is triggered.
The target for the S&P 500 remains between 6,000 and 6,100. There are multiple factors at this range where charts say it should end.
1. Take the Covid bottom on the S&P to the high of the 2021 bull market. This distance is 2,600 points. To find the measured move, add 2,600 points to the 2022 bear market low. This gives a price target of near 6,100 on the S&P 500.
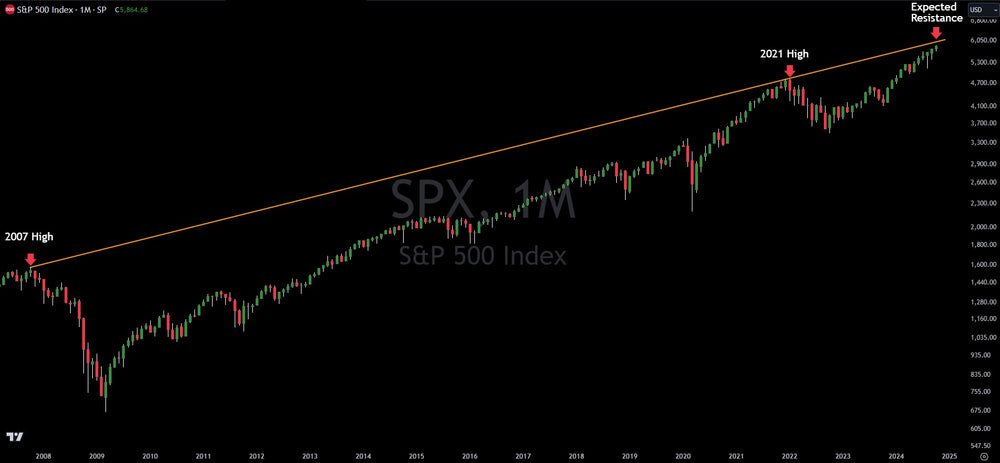
2. Another technical analysis technique utilizes the logarithmic chart of the S&P 500. Connect a trend line from the 2007 high (just before the Great Recession) to the high of 2021. Extend this trend line out and it its currently sitting right around 6,000. This can be seen in the chart above.
3. A shorter term trend line connects the high from July 2023 to the high of July 2024. That trend line extends out to be at approximately 6,000 as well.
Overall, the confluence of factors in the 6,000-6,100 area tells technical traders and investors there may be 2-4% more upside in the S&P, but then be very careful.
Ditch the hype, trade with data. Verified Investing delivers institutional-level technical analysis to retail investors. Make smarter decisions and achieve your financial goals.
This article is intended for informational and educational purposes only and does not constitute financial advice. All trading involves risk. Past performance is not indicative of future results. Trading involves substantial risk. All content is for educational purposes only and should not be considered financial advice or recommendations to buy or sell any asset.
Trading involves substantial risk. All content is for educational purposes only and should not be considered financial advice or recommendations to buy or sell any asset. Read full terms of service.


