
Semiconductor ETF (SMH) Head & Shoulder Pattern On Watch
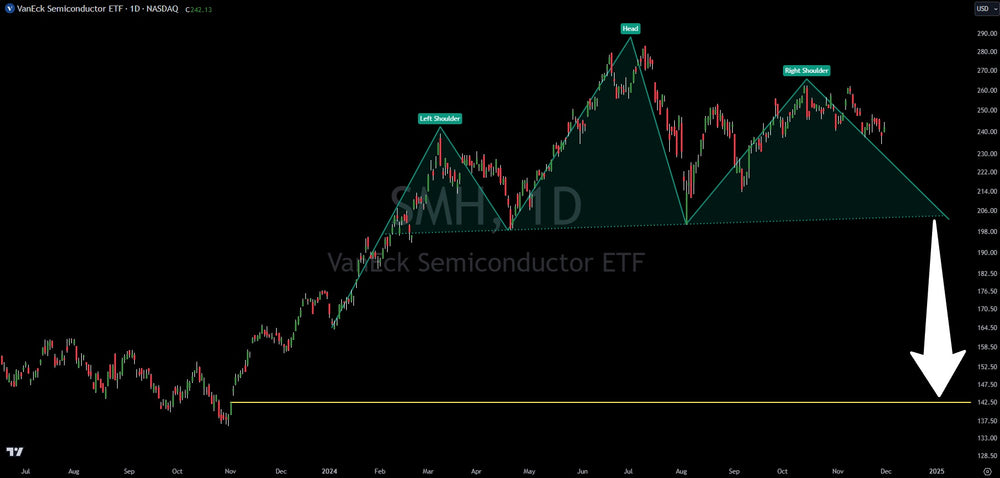
The VanEck Semiconductor ETF (SMH) is flashing a warning sign that savvy investors are watching closely. While the broader market flirts with record highs, SMH has formed a worrisome pattern – a potential head and shoulders – suggesting a possible downturn ahead.
Why does this matter? Semiconductors are often seen as a bellwether for the economy. The saying "where the semis go, the markets will follow" highlights their crucial role in everything from smartphones and computers to automobiles. A decline in semiconductor demand could signal a broader economic slowdown.
Adding to the concern, SMH hasn't reached a new all-time high since July 2024. This divergence from the overall market's upward trend raises red flags.
The head and shoulders pattern, if confirmed by a drop below $200, could trigger a significant sell-off, potentially pushing SMH down to $140 – a 42% decline from current levels. Such a dramatic fall would likely indicate a recessionary environment, as institutional investors recognize the deep connection between semiconductor performance and overall economic health.
All investors should keep a close eye on the VanEck Semiconductor ETF (SMH) chart. It could provide valuable insight into the market's future direction.
This article is intended for informational and educational purposes only and does not constitute financial advice. All trading involves risk. Past performance is not indicative of future results. Trading involves substantial risk. All content is for educational purposes only and should not be considered financial advice or recommendations to buy or sell any asset.
Trading involves substantial risk. All content is for educational purposes only and should not be considered financial advice or recommendations to buy or sell any asset. Read full terms of service.


