
Technical Analysis: S&P 500 Major Target Revealed
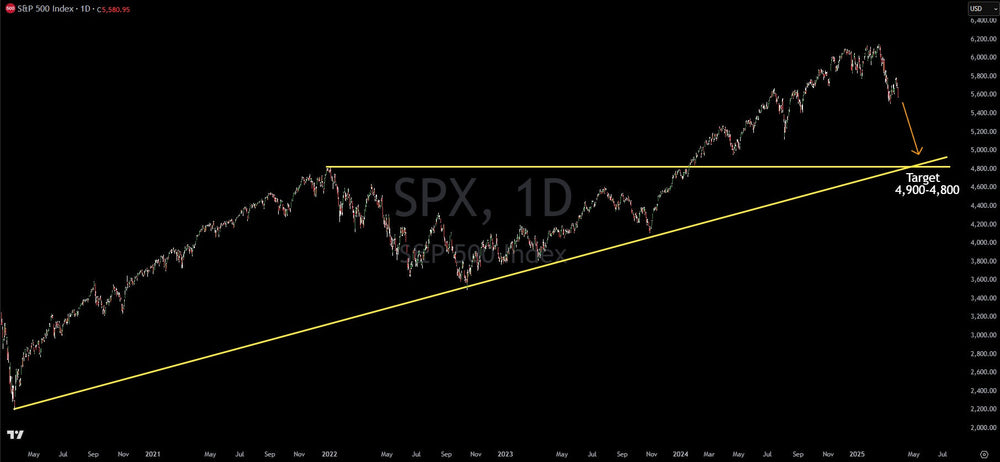
The S&P 500 has experienced a notable correction, falling nearly 10% from its record highs reached in February 2025. Following a brief upward consolidation, often referred to as a bear flag in technical analysis, selling pressure has resumed. This renewed downward momentum appears to be fueled by persistent concerns surrounding elevated stock valuations in the face of a potentially slowing economic growth outlook, compounded by ongoing issues related to tariffs and inflation.
Given the current market dynamics, a break below the recent low of 5,500 on the S&P 500 seems increasingly likely. While short-term bounces may occur, a more significant downside target in the range of 4,900 to 4,800 is anticipated later in 2025. This target zone is identified through established technical analysis techniques. The upper end of this range, around 4,900, is derived by extending a trend line connecting the major pivot lows observed during the March 2020 market bottom (triggered by the initial Covid-19 pandemic), the bear market low in October 2022, and a subsequent low in October 2023. Projecting this trend line forward provides a key technical target for investors.
Furthermore, the lower end of this target zone, approximately 4,800, aligns with a significant historical level: the bull market high reached by the S&P 500 in 2021. A technical retracement back to this prior peak would typically be considered a substantial support level. The convergence of these two independently identified technical targets in the 4,900-4,800 range creates a strong area of potential support.
This projected decline would represent a market correction of roughly 20% from the all-time highs, a level often considered a significant market downturn. This major support zone is likely to attract considerable attention from both short-term swing traders, who would anticipate a significant bounce, and potentially longer-term investors looking for a more attractive entry point. This analysis echoes the principles seen in other markets, such as the Hang Seng Index, where technical analysis helps identify key buy zones after significant pullbacks, as observed in its 2024 performance.
Verified Investing is committed to providing investors with purely data-driven analysis. We cut through mainstream media narratives and social media noise, focusing solely on objective charts and data. This rigorous approach empowers us and our members with probability-based trading insights, ultimately aiming to position us as the strategic "house" rather than speculative "gamblers."
This article is intended for informational and educational purposes only and does not constitute financial advice. All trading involves risk. Past performance is not indicative of future results. Trading involves substantial risk. All content is for educational purposes only and should not be considered financial advice or recommendations to buy or sell any asset.
Trading involves substantial risk. All content is for educational purposes only and should not be considered financial advice or recommendations to buy or sell any asset. Read full terms of service.


