
Trade It: Tesla (TSLA) Major Level Approaching
Tesla (TSLA) has experienced a significant downturn, entering what could be described as a tailspin. Since December 18th, 2024, the stock has plummeted approximately 40%, a dramatic reversal from its previous highs. This sharp decline can likely be attributed to a confluence of factors, including:
- Slowing Sales Growth: Tesla's growth trajectory, once a hallmark of its valuation, has shown signs of deceleration. Increased competition from established automakers and emerging electric vehicle (EV) companies, coupled with potential market saturation in certain regions, may be contributing to this slowdown.
- Elon Musk's Public Engagements: Elon Musk's increasing involvement in political discourse and controversial statements have generated both support and backlash. This polarization could be impacting investor sentiment and brand perception, potentially affecting Tesla's stock performance.
- Broader Market Conditions: It is important to remember that Tesla is also subject to broader market conditions. Changes in interest rates, economic uncertainty, and shifts in investor risk appetite can all contribute to stock volatility.
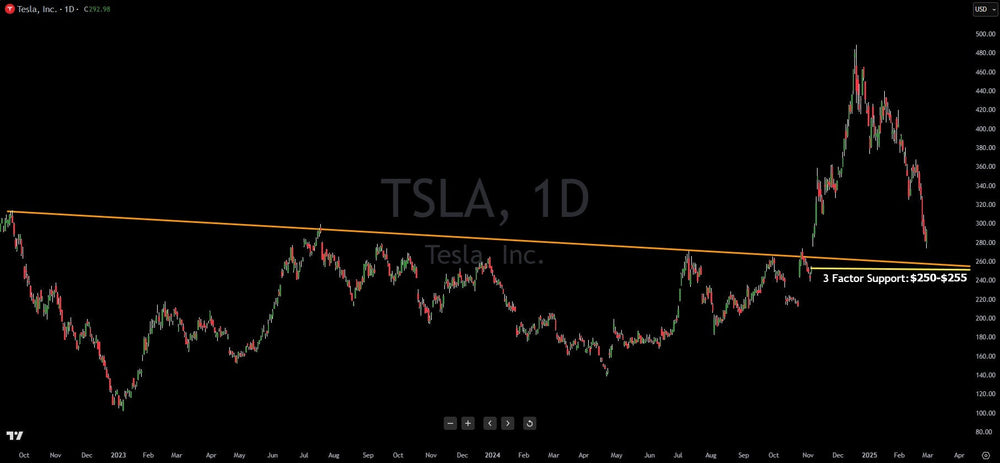
Despite the recent sell-off, astute swing traders are now focusing on identifying potential support levels where Tesla's stock could find a bottom and initiate a rebound. Technical analysis suggests a key support zone between $250 and $255, underpinned by three compelling factors:
-
Long-Term Trendline Retest:
- A significant down-sloping trendline, originating from the September 2022 peak and connecting the highs of July 2023, 2024, and October 2024, has acted as a persistent resistance level.
- Tesla's brief breakout above this trendline was a bullish signal, but the subsequent retracement suggests a potential retest of this trendline as a new support level.
- This trendline currently converges around $255, making it a critical area to watch. The principal of former resistance becoming future support is a time tested technical analysis tool.
-
Gap Fill from Election Rally:
- The surge in Tesla's stock price following Donald Trump's election victory created a noticeable price gap, propelling the stock towards its all-time high near $488.
- Technical analysts often observe that price gaps tend to be filled over time.
- The lower boundary of this gap is approximately $252, aligning closely with the other support indicators.
-
Fibonacci Retracement Level:
- Using the Fibonacci retracement tool, which measures potential support and resistance levels based on key price swings, we can analyze the retracement from Tesla's early 2023 low of $102 to its all-time high of $488.
- The 61.8% Fibonacci retracement level, a widely recognized and significant level, falls around $250.
- Fibonacci retracements are used by traders to attempt to predict where a stock price may find support during a pull back.
The convergence of these three technical factors—the long-term trendline retest, the gap fill, and the Fibonacci retracement level—creates a strong case for the $250-$255 zone acting as a significant support area for Tesla. If the stock price reaches this level, there is a heightened probability of a substantial bounce, offering potential opportunities for swing traders. It is important to remember that technical analysis is not perfect, and that other factors can effect the price of TSLA. Always practice good risk management.
This article is intended for informational and educational purposes only and does not constitute financial advice. All trading involves risk. Past performance is not indicative of future results. Trading involves substantial risk. All content is for educational purposes only and should not be considered financial advice or recommendations to buy or sell any asset.
Trading involves substantial risk. All content is for educational purposes only and should not be considered financial advice or recommendations to buy or sell any asset. Read full terms of service.


