
Walmart (WMT) Chart Signals Pullback As Valuation Gets Insane
Shares of Walmart (WMT) have continued to rise as low income shoppers still frequent the store and higher income shoppers trade down to Walmart as the economy and inflation bite.
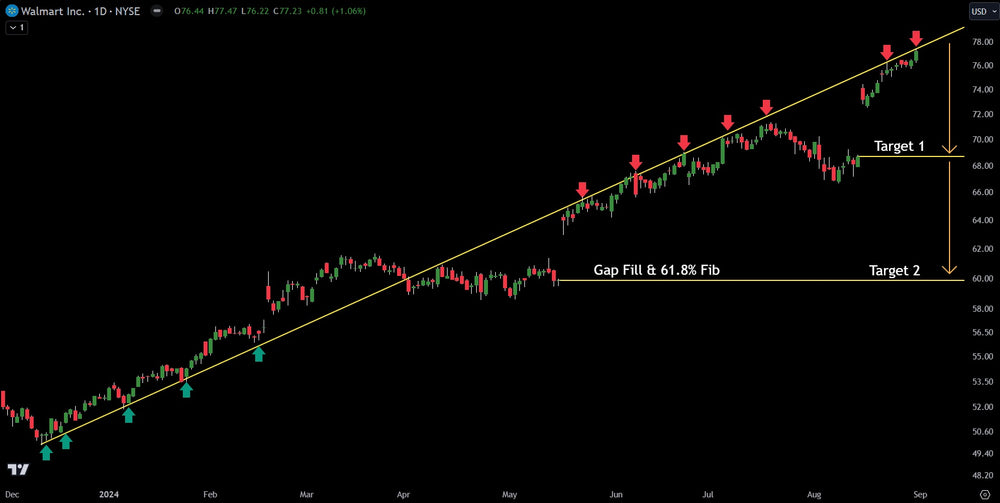
However, based on the technical chart, Walmart is looking like a sell. The stock has pushed into a major up-sloping resistance line that has held price in check since 2023. The RSI is north of 85 (overbought) and as the economy weakens more, the consumer will pull back on spending.
The forward price-to-earnings ratio is trading near 25, around what Apple (AAPL) and Microsoft (MSFT) are trading at. Walmart is doing well, but it is no tech stock.
The Walmart has two major target levels to the downside. The first is a gap fill at $68.75. This is a stopping point but not a major buying point. The second target is a major gap fill and also aligns perfectly with the Fibonacci 61.8% retrace. The two levels together give a major level of support and likely at least a great swing trade opportunity to the buy side.
Verified Investing analyzes charts and data to give investors non-biased probability based buy and sell signals. This contrasts with the mainstream media's narratives and social media's hype. Narratives and hype usually get investors to react with emotion, while data based analysis allows them to react based on probability. Investing properly is about being the casino, not the gambler.
This article is intended for informational and educational purposes only and does not constitute financial advice. All trading involves risk. Past performance is not indicative of future results. Trading involves substantial risk. All content is for educational purposes only and should not be considered financial advice or recommendations to buy or sell any asset.
Trading involves substantial risk. All content is for educational purposes only and should not be considered financial advice or recommendations to buy or sell any asset. Read full terms of service.


