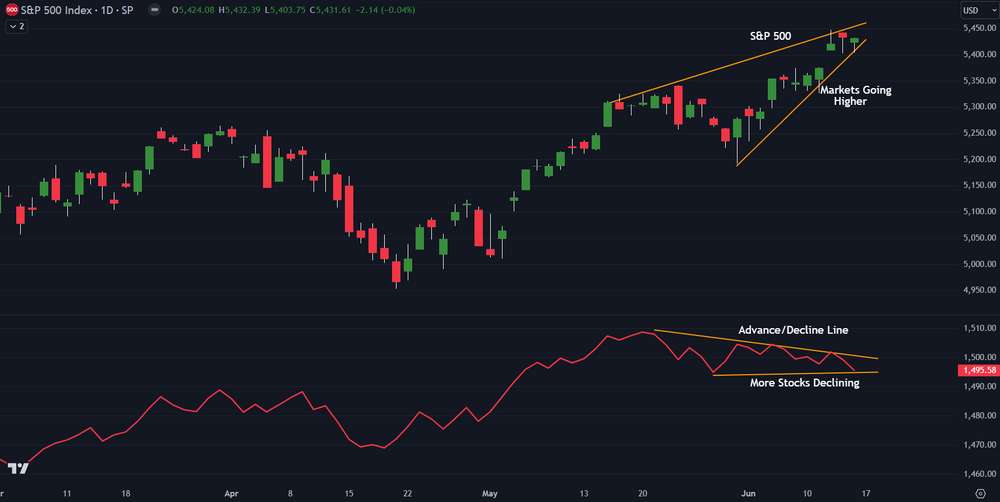
Warning: S&P 500 Makes New All-Time Highs, Advance-Decline Line Falls

Negative divergences are everywhere on the S&P 500 and the NASDAQ 100. One of the major indicators of underlying weakness in the S&P 500 is the advance/decline line.
The advance/decline line shows how many stocks are rising vs. how many stocks are falling. This is a way for technical investors and traders to measure the overall health of the market. An rising advance/decline line with a market that is moving higher shows wide participation in the rally. A falling advance/decline line with a rising market shows low participation in the rally.
Currently, as seen in the chart above, the S&P 500 is making new all-time highs but the advance/decline line has been falling. This tells investors that the market move higher is a select group of stocks, namely the trillion-Dollar names.
Historically, it foretells a market decline.
Trading involves substantial risk. All content is for educational purposes only and should not be considered financial advice or recommendations to buy or sell any asset. Read full terms of service.


