Weekly S&P 500 Technical Analysis

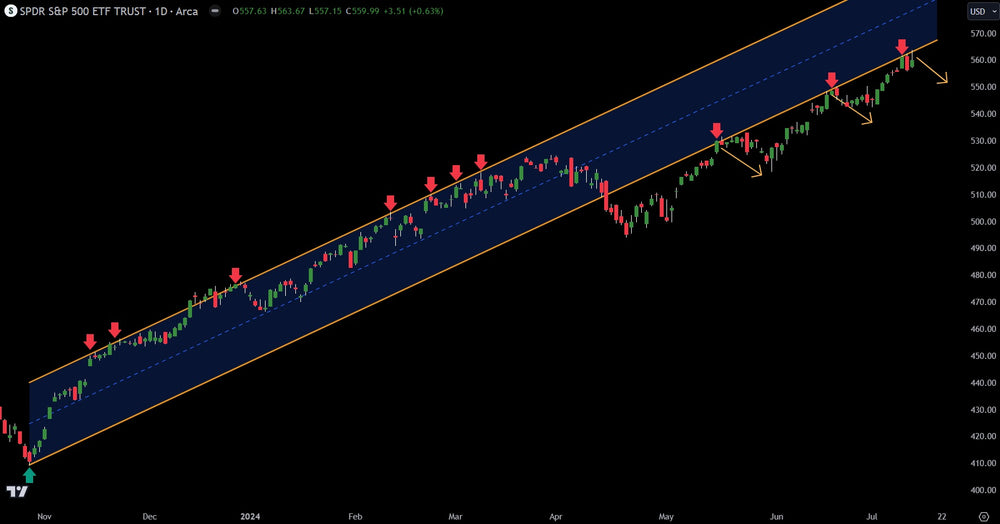
The S&P 500 had a wild week. After the mega trillion-Dollar stocks took it up early in the week, it flushed sharply on Thursday. This put in a technical reversal candle on the daily chart. While Friday saw a rebound from buy-the-dippers, late selling emerged and capped the gains. The reversal candle from Thursday is still holding and probabilities favor the downside.
In addition, price of the S&P 500 has been hammering on the underbelly of a channel trend line. Every time it hits, there has been a sell in the S&P 500. Last week it hit again. History has shown technical traders that a pullback is likely.
Traders and investors should look for more weakness in the coming days. Note the chart above.
Trading involves substantial risk. All content is for educational purposes only and should not be considered financial advice or recommendations to buy or sell any asset. Read full terms of service.


