Weekly Technical Analysis On Gold

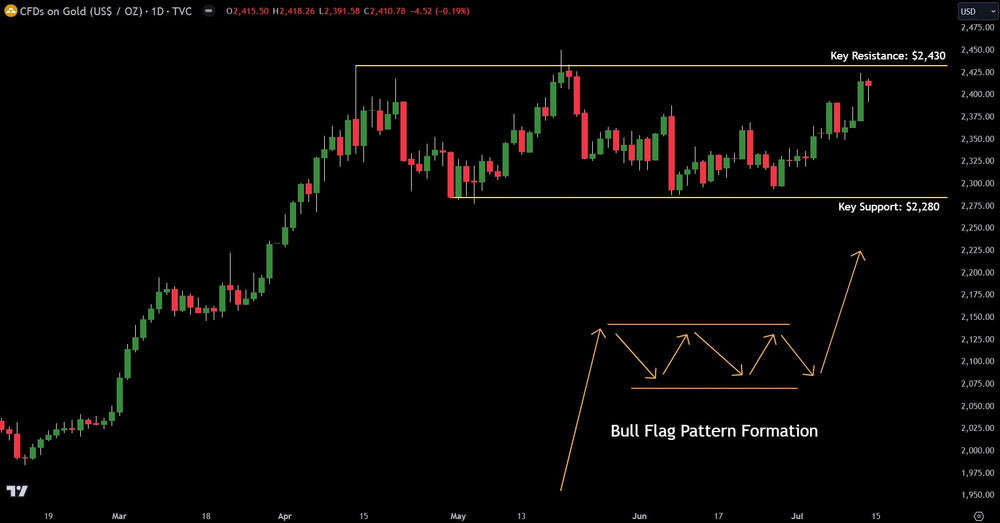
After hitting an all-time high of $2,432 on April 12th, 2024, gold has been chopping sideways. In technical analysis this is called bullish consolidating. It speaks to the digestion of the big move up from $2,000 that started early in the the year.
Bullish consolidation occurs when price surges higher, then goes into a sideways chop where buyers equal sellers. When price does this, it strongly favors another upside move in price. That is what is happening now with gold.
The key levels to watch for a breakout is $2,430. Should price have a daily close above it, the next stop is over $2,500. While probabilities don't favor it, should price ever have a daily close below $2,280, the bullish pattern would be broken and price could trade down to $2,190.
A good trader and investor knows their levels both on the bullish and bearish side. Verified Investing helps investors look purely at the data and charts to make informed decisions without any emotion. This breeds success. Investors that follow the narratives in mainstream media or the hype on social media usually end up losing money.
Trading involves substantial risk. All content is for educational purposes only and should not be considered financial advice or recommendations to buy or sell any asset. Read full terms of service.


