Q2 GDP Revised Up to 2.2%, and the Upgrade Came From Real Growth, Not Prices

Published by Verified Investing | U.S. Economic Metrics
Released: September 30, 2026 | Data Period: Q2 2026 (April–June) | Source: U.S. Bureau of Economic Analysis — Third Estimate
Key Takeaways
- Real GDP was revised up to 2.2% annualized from 1.5%, a 0.7-point upgrade, mainly from investment, consumer spending and government spending.
- Private demand was much stronger than the headline. Real final sales to private domestic purchasers grew 4.6%, up from 3.9% in the advance estimate and 4.2% in the second.
- The price side was revised down. The GDP price deflator now stands at 6.1% annualized. The second estimate's 8.0% nominal and 1.5% real implied roughly 6.4%. PCE inflation for the quarter was cut to 5.0% from 5.3%.
- Nominal GDP grew 8.5% annualized, the fastest of any quarter in the past three years.
- Q1 was also revised up to 2.5% from 2.1% in BEA's annual update, so the first half of 2026 was stronger than reported in real time.
- Watch October 29: the Q3 GDP advance estimate and September PCE come out together.
Why This Report Matters Right Now
When the second estimate came out in August, it confirmed 1.5% growth with a deflator around 6.4%. That looked like stagflation: weak output and high prices. The third estimate changes that picture.
Growth wasn't weak. It was underestimated. And this time the revision raised real output while lowering the price measures. More of the economy's nominal growth turned out to be volume and less of it inflation.
That changes the Fed's problem. The FOMC raised rates a quarter point to 3.75%–4.00% on September 16. A stagflating economy would have argued for stopping there. An economy growing above trend, with private demand running at 4.6% and the deflator at 6.1%, argues that the hike may not be the last one.
What Everyone Will Focus On vs. What Matters More
What everyone will focus on: 2.2% real GDP. It's a solid number, but third estimates rarely move markets, so most readers will skim past it.
What matters more: The 0.7-point revision and where it came from.
Third estimates usually move by a few tenths at most. This one moved real GDP by 0.7 points, and it pushed the two halves of the report in opposite directions:
| Q2 2026, % SAAR | Advance | Second | Third |
|---|---|---|---|
| Real GDP | 1.5 | 1.5 | 2.2 |
| Real final sales to private domestic purchasers | 3.9 | 4.2 | 4.6 |
| Current-dollar (nominal) GDP | 7.9 | 8.0 | 8.5 |
| PCE price index | 5.1 | 5.3 | 5.0 |
| Core PCE price index | 3.4 | 3.6 | 3.3 |
| Gross domestic purchases price index | 5.7 | 5.8 | 5.6 |
| Real GDI | — | 2.2 | 2.6 |
Source: BEA, GDP (Third Estimate), 2nd Quarter 2026.
Real measures went up and price measures came down. In the second estimate the economy looked like it was barely growing under heavy inflation. In the third, it's growing well with inflation that is still high, but less extreme.

Real GDP held at 1.5% through two estimates, then jumped to 2.2%. Private final sales, the cleanest measure of underlying demand, rose with every estimate, from 3.9% to 4.6%.
Where the Upgrade Came From
BEA attributes the revision mainly to three areas:
Investment. Both inventories and fixed investment were revised up. Within fixed investment, the biggest change was nonresidential structures, led by commercial and health-care construction, mainly data centers. That's based on revised Census construction data for May and June. Residential improvements were also revised up.
Consumer spending. Services were revised up, led by recreation services (mainly admissions to spectator events), based on new Quarterly Services Survey data. Air transportation was revised down. Goods were revised up, led by information processing equipment.
Government. Most of the government revision was federal defense spending, reflecting updated seasonal adjustment factors.
The data-center line is the one to keep in mind. Data-center construction is being driven by a powerful investment cycle that may be less sensitive to current borrowing costs than housing or consumer credit. That helps explain why tighter policy has not cooled every part of investment equally That's part of why tight policy hasn't cooled investment as much as you'd expect.
Gross domestic income tells a similar story. Real GDI grew 2.6%, and the average of GDP and GDI was 2.4%, revised up 0.6 points. Both the spending side and the income side of the economy now point to above-trend growth.
The Deflator Is Still the Inflation Problem, Just a Smaller One
The revision doesn't make inflation go away. The GDP deflator ran at 6.1% annualized in Q2, nearly double Q1's 3.2%, and it's up 4.0% year-over-year. Nominal GDP grew 8.5%. An economy growing more than 8% in nominal terms isn't one where a 4% policy rate looks tight.

The deflator outpaced real growth in five of the last eight quarters. Q2 2026 shows the widest gap in this window: 6.1% prices against 2.2% real growth.
What changed is the composition. In August, the story was that real output was weak and the economy was mostly producing inflation. Now the story is that real output is strong and inflation is still high. The first gives the Fed more reason to hesitate. The second strengthens the case for keeping further tightening on the table.
Corporate profits fit this picture too. Profits from current production rose $384.0 billion in Q2 (revised down $16.9 billion). With 8.5% nominal growth, revenue rises quickly in dollar terms, and companies that can pass on prices keep the gain.
What Traders Should Watch
The following is provided for educational purposes only and does not constitute investment advice.
1. October 29: Q3 GDP advance estimate. The question is whether above-trend growth continued into Q3. July and August real consumer spending rose 0.1% and 0.6%, so the consumer component is likely to be solid. If Q3 prints near or above 2%, the "first half was the peak" argument loses ground.
2. The Q3 deflator. A drop back toward 3%–4% annualized would mean Q2's 6.1% was a one-quarter energy and tariff spike. A second quarter above 5% would mean the economy is running hot on both growth and prices, which is the worst combination for duration.
3. Private final sales, not headline GDP. Real final sales to private domestic purchasers is the better read on demand. At 4.6%, it doesn't fit the idea of a cooling economy. A drop below 2.5% in Q3 would be the first real sign of demand slowing.
4. Data-center construction as its own driver. Nonresidential structures led the investment upgrade. Monthly construction spending data from Census will show whether that keeps going. Rate-insensitive investment is part of why tight policy isn't slowing the economy much.
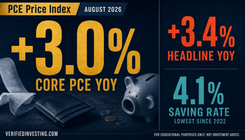
5. The long end of the curve. Stronger real growth with the deflator still at 6.1% supports higher term premiums. A string of upward GDP revisions plus sticky core PCE (3.0% YoY in August) works against a quick drop in long-term yields.
What would change the read: a Q3 advance print below 1.5% with private final sales slowing sharply would bring back the slowdown story. A Q3 deflator below 3.5% would say the Q2 price spike has passed.
Bottom Line
The third estimate changed what Q2 2026 looked like. Real GDP was revised from 1.5% to 2.2%, private demand grew 4.6%, and the price measures were revised down. The third estimate substantially weakens the stagflation read. Growth was stronger than reported while inflation remained high. That weakens the case for stopping after September's hike. On October 29, the day after the next FOMC decision, check whether private final sales held up in Q3. If private final sales remain this strong in Q3, the case for additional tightening would remain very much alive.
Source: U.S. Bureau of Economic Analysis — GDP (Third Estimate), Industries, Corporate Profits, State GDP, and State Personal Income, 2nd Quarter 2026 (BEA 26-42, released September 30, 2026)
This article is published for educational and informational purposes only. Nothing contained herein constitutes investment advice or a recommendation to buy or sell any security. Please consult a qualified financial professional before making any investment decisions.
Trading involves substantial risk. All content is for educational purposes only and should not be considered financial advice or recommendations to buy or sell any asset. Read full terms of service.