JOLTS March 2026: 0.95 Jobs Per Worker. The Fed Has No Room to Use It.

Published by Verified Investing | U.S. Economic Metrics Released: May 5, 2026 | Data Period: March 2026 | Source: U.S. Bureau of Labor Statistics

Key Takeaways
- Hires surged to 5.6 million in March — a +655K monthly jump and the highest hires level since February 2024. The hires rate hit 3.5%, also the highest since May 2024. This will dominate today’s coverage.
- It’s the wrong number to lead on. Job openings fell again to 6.87 million — the fourth decline in the last five months. Layoffs and discharges climbed to 1.9 million, with most of the increase concentrated in Professional and Business Services. The hires bounce is sitting on a softening trend.
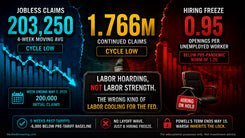
- The openings-to-unemployed ratio sits at 0.95 — meaning there are now fewer job openings than unemployed workers. The pre-pandemic norm was roughly 1.20. The 2022 cycle peak was near 2.00. The Fed’s preferred labor market tightness gauge has fully rebalanced.
- Quits ticked up to 2.0% from 1.9% — but down YoY from 2.2%. Workers are slightly more willing to job-switch month-on-month, but the yearly trend on worker confidence is still down. Wage pressure from the quits channel keeps fading.
- Information sector openings are down 33% year-over-year — the steepest decline of any private sector. Federal openings are down 41% YoY. The job market is segregated, and the cyclical white-collar parts are weakening fastest.
- This is the labor market the Fed has been waiting for. With ISM Services Prices at 70.7 (a four-year high), Manufacturing Prices at 84.6, and Brent above $108, the inflation regime won’t let the Fed take the win. Powell’s term ends May 15. Warsh inherits the box.

What This Metric Measures — and Why It Matters Right Now
JOLTS — the Job Openings and Labor Turnover Survey — is the BLS’s monthly read on the demand side of the labor market. NFP tells you how many jobs were added. Initial Claims tells you how fast layoffs are running. JOLTS tells you how many jobs employers say are open, how many workers they actually hired, how many quit, and how many got laid off. It’s the only widely-watched government series that tracks all four flows in one report.
For traders, the most important number in JOLTS is not the openings level itself — it’s the openings-to-unemployed ratio: openings divided by the number of unemployed workers from the household survey. When that ratio is above 1.0, there are more open jobs than people looking. The Fed has cited this ratio explicitly for years as evidence the labor market is “tight” — and that has been the public justification for keeping rates restrictive.
The other forward-looking number is the quits rate. Workers quit when they’re confident they can find something better. A high quits rate signals a tight market and pulls wage inflation higher with a few months’ lag. A falling quits rate signals workers are getting less confident — usually before that confidence loss shows up anywhere else.
JOLTS lags the rest of the labor calendar by about five weeks. By the time March JOLTS is released, Friday’s April NFP is two days away. April Claims data is already in. So this report isn’t a real-time read on the labor market today. It’s the cleanest single look at where employer demand-for-labor and worker confidence sit going into Friday.
What Everyone Will Focus On vs. What Matters More
Today’s headline is the hires surge. Hires jumped +655K to 5.6 million — the biggest single-month rise in over a year. The hires rate at 3.5% is the strongest since May 2024. Wire-service framing will be straightforward: the labor market just heated up.
One thing matters more: that ratio at 0.95.
There were 6.87 million job openings and 7.24 million unemployed workers in March. That means roughly 1.05 unemployed workers competed for every open job. Pre-pandemic, the norm was the opposite — roughly 1.20 jobs available per unemployed worker. At the 2022 cycle peak it was near 2.00. The Fed has been citing this ratio in every press conference for three years as evidence the labor market is tight enough to keep wage pressure live.
That argument is empirically gone. Job openings have declined for the fourth time in five months. The ratio first dipped below 1.00 in March 2025 and has been pinned in a 0.87–1.02 range since. Friday’s ISM Manufacturing Employment came in at 46.4 — its weakest 2026 print. Monday’s ISM Services Employment held in contraction at 48.0 for the second straight month. Both surveys, plus today’s JOLTS, point the same direction.
The hires surge is evidence in the same direction, not against it. Look closer at March: layoffs and discharges climbed +153K, with most of that growth concentrated in Professional and Business Services — exactly the cyclical white-collar sector that signals turning points. Information job openings are down 33% year-over-year, the steepest decline of any private industry. Federal openings are down 41% YoY. The hires bump came from transportation and warehousing, P&B services, and accommodation/food — not from broad-based tightening.
This is churn through a softening market, not strength heating into a tight one. The Fed got the labor moderation it has been waiting for. The problem is that the inflation regime never cooperated.
Data Breakdown
March 2026 — JOLTS Headline Levels and Rates
| Metric | Feb 2026 (rev.) | Mar 2026 | Change | Rate (Mar) |
|---|---|---|---|---|
| Job Openings | 6.92M | 6.87M | −56K | 4.1% |
| Hires | 4.95M | 5.60M | +655K | 3.5% |
| Total Separations | 5.04M | 5.40M | +356K | 3.4% |
| Quits | 3.07M | 3.19M | +125K | 2.0% |
| Layoffs and Discharges | 1.74M | 1.89M | +153K | 1.2% |
| Other Separations | 0.28M | 0.34M | +76K | 0.2% |
| Openings-to-Unemployed Ratio | 0.91 | 0.95 | +0.04 | — |
Source: BLS JOLTS, May 5, 2026 release. Ratio computed using BLS Employment Situation unemployed level (7.24M for March 2026).
The headline mix tells you the report’s character. Every flow category — hires, quits, layoffs — moved up at once. That’s not a tightening labor market. That’s a market with more activity at every margin: more workers being hired, more workers walking out, more workers being let go. Job openings, the cleanest read on underlying employer demand, ticked down again.
The sector internals reinforce the read. Job openings fell sharply in Professional and Business Services (−318K), partially offset by gains in finance and insurance (+98K). The same sector — Professional and Business Services — also saw the largest increase in layoffs in March. White-collar cyclical demand is contracting on both sides of the ledger at once. Information sector openings have collapsed 33% year-over-year. Government openings are down 13% YoY, with federal openings down 41% YoY since the prior March, reflecting the cumulative impact of federal headcount reductions.
The bright spots — retail trade openings up 58% YoY, manufacturing openings up 18% YoY — aren’t big enough to offset the drag from white-collar services, and they aren’t where wage pressure tends to come from in this cycle.
February revisions: February openings were revised up by 40K to 6.92M, hires were revised up by 50K to 4.95M, and quits were revised up by 72K to 3.07M. The revisions tighten February’s previously soft read but don’t change the directional story.
The Forward-Looking Signal
Two threads matter going forward.
First, the quits rate. Quits ticked up to 2.0% in March from 1.9% in February — a one-tick increase in worker confidence about job-switching. But the year-over-year reading is still down: 2.0% versus 2.2% in March 2025. The 2025 annual average was 2.0%. Workers are now switching jobs at exactly the rate they did across all of 2025 — meaningfully below the 2022–2023 wage-pressure period. Quits-driven wage inflation is fading, not reaccelerating. That removes one more piece of the case for sticky labor-side inflation.
Second, the manufacturing-to-services pipeline applies here too. Friday’s ISM Manufacturing Employment came in at 46.4. Monday’s ISM Services Employment was 48.0. Both surveys’ employment indices are now in contraction. That tends to lead JOLTS hires and openings by 1–2 months. April JOLTS, which won’t release until June 2, is more likely to show further softening in hires and openings than continued bouncing.
Net: employer demand for labor keeps drifting lower; worker confidence is essentially flat YoY at the 2025 pace; layoffs are quietly building in the cyclical white-collar sector. None of that is a labor market the Fed needs to keep restrictive policy to fight.
What Traders Should Watch
The following is provided for educational purposes only and does not constitute investment advice.
-
Friday May 8 — April NFP. The most direct test. ISM Services and Manufacturing Employment both contracting, JOLTS openings continuing lower — three independent labor reads pointing the same direction. A weak April NFP confirms the read; a strong one would force a reset of the cooling narrative.
-
May 12 — April CPI. The other half of the box. JOLTS just gave the Fed permission to cut on the labor side. CPI will say whether they have any room. Services CPI components are the ones to watch — if they reflect the upstream pressure visible in ISM Services Prices at 70.7, the inflation door stays closed regardless of what the labor data says.
-
May 15 — Warsh assumes Fed Chair. Powell’s term ends. Warsh inherits a labor market that has rebalanced and an inflation regime that hasn’t. The first major question will be whether his framing changes at all from the April 28–29 FOMC statement.
-
June 2 — April JOLTS. The next confirming print. With ISM employment indices at 46.4 (manufacturing) and 48.0 (services), expect openings to drift lower again. A move below 6.7M would put openings at the cycle low and push the ratio toward the 0.85–0.90 range.
-
Professional and Business Services as the cyclical canary. Openings down 318K in March, layoffs up the most of any sector. Information openings −33% YoY. The white-collar layoff cycle that’s been quietly building since 2024 is still expanding. Sectors and ETFs heavily exposed to staffing, consulting, and tech-adjacent services face a labor-side headwind that the broad indices haven’t fully priced.
Historical Context
The openings-to-unemployed ratio is one of the cleanest summary statistics in U.S. labor data. It sat at roughly 1.20 in 2018–2019, briefly collapsed during the 2020 shock, recovered through 2021, peaked near 2.00 in early-to-mid 2022 — the tightest reading on this gauge in the JOLTS era — and has been falling almost continuously since.
The ratio first dipped below 1.0 in March 2025, spent the next several months bouncing above and below the line, and was decisively below it from August onward. It bottomed at 0.87 in December 2025 and has bounced in the 0.87–0.99 range every month since. March 2026 at 0.95 sits in the middle of that range. Pre-pandemic, the ratio was at 1.20 — meaning the current labor market actually has less demand-side tightness than the 2018–2019 economy that the Fed was raising rates into.
That’s the historical anchor that matters: at no point in the post-2022 cycle has the Fed had this much labor-side cover for cuts. What it lacks is the inflation cover. ISM Services Prices haven’t fallen below 60 in 17 straight months. Manufacturing Prices are at 84.6 — the highest since April 2022. The Iran war is in its second month with Brent at $108–113. The petroleum cost shock is still flowing through supply chains.
The 2018–2019 episode is the closest historical analogue for the labor side — but not for the inflation side. Then, the Fed was hiking into a tight-but-cooling labor market with subdued inflation. Now, the Fed is holding into a rebalanced labor market with sticky inflation. That asymmetry is what makes this cycle different.
Bottom Line
The hires number will dominate today’s coverage. Wire services will say the labor market heated up. Most of them won’t say that openings declined again, that layoffs jumped in white-collar services, or that the openings-to-unemployed ratio sits at 0.95 — well below the pre-pandemic norm.
That ratio is the part of the report that matters for traders. The Fed has been waiting for this labor market for two years. It has it. What it doesn’t have is inflation room to do anything with it. Friday’s NFP and next week’s CPI will set up Warsh’s first week.
0.95 is what labor looks like when the inflation regime won’t let the Fed do its job. That’s the box.
Source: U.S. Bureau of Labor Statistics — Job Openings and Labor Turnover Survey, March 2026 (USDL-26-0683, released May 5, 2026)
This article is published for educational and informational purposes only. Nothing contained herein constitutes investment advice or a recommendation to buy or sell any security. Please consult a qualified financial professional before making any investment decisions.
Trading involves substantial risk. All content is for educational purposes only and should not be considered financial advice or recommendations to buy or sell any asset. Read full terms of service.