April NFP: 115K Jobs Beat the Forecast. 803K Americans Slipped Into Fresh Distress.

Published by Verified Investing | U.S. Economic Metrics Released: May 8, 2026 | Data Period: April 2026 | Source: U.S. Bureau of Labor Statistics
Key Takeaways
- Total nonfarm payrolls rose +115,000 in April, beating the Dow Jones consensus of +55,000 by roughly 60K, with the unemployment rate unchanged at 4.3%.
- The headline beat is the smallest story in the report. The household survey shows 358,000 Americans newly unemployed (jobless less than 5 weeks) plus 445,000 newly working part-time for economic reasons — roughly 803,000 workers moving into fresh labor-market distress in a single month.
- BLS framed the 12-month picture explicitly: payrolls have shown “little net change over the prior 12 months.” Chicago Fed President Austan Goolsbee said the same thing in a CNBC interview the morning of release: “pretty much stable for a year, year and a half.”
- The healthcare strike distortion has fully washed out. April healthcare added +37,000, in line with the 12-month average of +32,000. March’s +76,000 strike reversal was the one-off framing held up. The underlying hiring trend is the +115K, and that trend is weak.
- Revisions deteriorated the prior two months. February was revised from -133K to -156K, the worst single-month payroll loss in the current cycle. March was revised up modestly from +178K to +185K. Net: 16,000 fewer jobs across the two months.
- Average hourly earnings rose +0.2% MoM and +3.6% YoY, both below consensus (0.3% / 3.8%) but with the YoY rate ticking up 10 bps from March’s 3.5%. Wage deceleration has stalled.
- Powell hands Warsh this print on Friday, May 15. Combined with ISM Manufacturing Prices at 84.6 (highest since April 2022) and ISM Services Prices at 70.7, this is two-survey stagflation confirmed across the entire economy. The incoming Fed Chair inherits a labor market soft enough to want cuts and inflation hot enough to forbid them.
Why This Matters Right Now
The April jobs report is the first national labor reading collected entirely inside the new macro regime. The reference period ended April 12 — three weeks into the Iran war, with Brent above $110, the IEEPA tariffs already struck down and replaced with a 150-day global tariff, and Kevin Warsh confirmed as Powell’s successor effective May 15.
That handover is Friday. This is the labor read Warsh inherits — and Powell’s parting print. Three data points will shape Warsh’s opening posture: this report, this Tuesday’s April CPI, and this Wednesday’s April PPI. The first of the three tells a more important story than the +115K headline suggests.
What Everyone Will Focus On vs. What Matters More
What everyone will focus on: Payrolls “blew past” the +55,000 Dow Jones consensus by roughly 60K. CBS led with “blowing past forecasts.” Trading Economics framed it as “way above market forecasts.” That beat-the-consensus reflex will drive most wire coverage of this report.
What matters more: The establishment survey added 115,000 jobs. The household survey, in the same release, added 803,000 Americans to distress categories. That’s not a contradiction — it’s one picture viewed from two angles. People are losing full-time work and either landing in part-time roles for economic reasons (+445K), or moving onto the unemployment rolls for less than five weeks (+358K). These are independent populations measured by an independent survey, and both moved sharply in the same direction in the same month.
BLS itself made the broader framing explicit: payrolls have “shown little net change over the prior 12 months.” Twelve months of monthly prints summing to a number small enough that BLS calls it no net change. That is the labor market picture. The +115K is one data point inside a flat year, not a rebound from one.
The wage internals point the same way. Average hourly earnings came in below consensus on both measures (+0.2% MoM and +3.6% YoY versus +0.3% and +3.8%) — genuinely soft in absolute terms. But the YoY rate is 10 bps higher than March’s 3.5%, meaning the deceleration that gave the Fed flexibility in the March report has stalled. Wages soft enough to come in below expectations, not soft enough to keep cooling. That combination is what stagflation looks like on the labor side.
Data Breakdown
Summary Table
| Metric | April 2026 | March 2026 (Rev.) | February 2026 (Rev.) |
|---|---|---|---|
| Total NFP | +115,000 | +185,000 | −156,000 |
| Dow Jones Consensus | +55,000 | — | — |
| Unemployment Rate | 4.3% | 4.3% | 4.4% |
| Labor Force Participation | 61.8% | 61.9% | 62.0% |
| Avg. Hourly Earnings (MoM) | +0.2% | +0.2% | +0.4% |
| Avg. Hourly Earnings (YoY) | +3.6% | +3.5% | +3.8% |
| Avg. Hourly Earnings (Level) | $37.41 | $37.38 | $37.32 |
| Avg. Workweek (hrs) | 34.3 | 34.2 | 34.3 |
| Jobless < 5 weeks (Δ) | +358,000 | — | — |
| Part-time for econ. reasons (Δ) | +445,000 | — | — |
Sources: BLS Employment Situation, April 2026 (USDL-26-0687) and prior revisions. February and March revisions published in the May 8 release.
The Charts


Sector Analysis: Healthcare Back to Trend, Information Keeps Bleeding
April healthcare added +37,000 — within rounding distance of the 12-month trailing average of +32,000. Nursing and residential care facilities contributed +15,000 and home health care services +11,000. March’s +76,000 was the strike-reversal one-off the prior article framed it as; April confirms it. The underlying hiring trend in the largest job-creating sector is back to its trailing run rate.
Transportation and warehousing added +30,000, driven almost entirely by couriers and messengers (+38,000). The sector is still down 105,000 from its February 2025 peak — April is a bounce against a longer-term decline, not a trend reversal.
Retail trade added +22,000, concentrated in warehouse clubs and supercenters (+18,000) and building materials (+13,000). Department stores lost 7,000 and electronics retailers lost 2,000 — the familiar bifurcation between value-format and traditional retail. BLS notes retail employment has shown “little net change” over the trailing 12 months.
Social assistance continued its uptrend at +17,000, the most persistent job-creation engine in the cycle.
The losses tell their own story. Information shed another 13,000 jobs, down 342,000 (-11.0%) since its November 2022 peak. Telecom, motion pictures, and computing infrastructure all contracted. Challenger Gray reported on release day that about one in four April layoffs cited AI as the reason. The information-sector decline is the cleanest available read on AI-driven labor displacement, and it is accelerating.
Federal government employment fell another 9,000, bringing the cumulative reduction from October 2024 to 348,000 (-11.5%). The DHS partial shutdown that started February 14 and ended in late April did not directly distort April’s federal count — BLS technical notes confirm furloughed workers were counted as employed because they received or will receive pay for the reference period. Manufacturing was essentially flat at -2,000.
The Household Survey: 803,000 in Fresh Distress
The establishment survey delivered the +115K beat. The household survey told a categorically different story in the same release.
The number of people unemployed less than five weeks increased by 358,000 to 2.5 million. This is the cleanest available measure of fresh labor distress — workers who were employed (or out of the labor force) and just moved into unemployment. A single-month increase of that magnitude is not noise.
The number of people working part-time for economic reasons increased by 445,000 to 4.9 million. These workers want full-time employment but couldn’t find it or had their hours cut. They count as employed in the headline establishment number — which is part of why the +115K does not reflect what is actually happening.
Combined: roughly 803,000 Americans moved into fresh labor distress in April. That number, set against the +115,000 headline, is the report.
Three additional household survey readings reinforce the picture. Labor force participation edged down to 61.8% from 61.9%. The unemployment rate held at 4.3% partly because some workers in distress are leaving the labor force entirely. Long-term unemployed (27+ weeks) was essentially unchanged at 1.8 million but now accounts for 25.3% of all unemployed — meaning a quarter of the unemployed have been out of work for more than half a year.
The Forward-Looking Signal: Two-Survey Stagflation, Confirmed on the Labor Side
April is the first month in which all three of the Fed’s primary labor indicators — ISM Manufacturing Employment, ISM Services Employment, and NFP — point the same direction. ISM Manufacturing Employment came in at 46.4 in April, contractionary. ISM Services Employment came in at 48.0, also contractionary. NFP delivered a +115K headline that BLS itself called part of a 12-month period of “little net change.” Three independent surveys, three labor-side cooling signals, one month.
In a normal cycle, that combination clears the path for rate cuts. In this cycle, it doesn’t. The same two ISM surveys are showing the highest input-cost readings in four years. ISM Manufacturing Prices ran at 84.6 in April, the highest since April 2022. ISM Services Prices ran at 70.7, tied for the highest since October 2022. The manufacturing-to-services prices pipeline has 1–3 months of further pass-through to run. Petroleum-side cost pressure from the Iran war is still flowing through supply chains. This Tuesday’s April CPI and Wednesday’s April PPI will tell us how much has already pushed through to consumer prices and producer margins.
That is the labor market Powell hands Warsh on Friday. The Fed has the labor weakness it would normally use to justify cutting. It does not have the inflation backdrop that would let it.
What Traders Should Watch
The following is provided for educational purposes only and does not constitute investment advice.
-
April CPI Tuesday and April PPI Wednesday close the inflation loop. If goods inflation accelerates while labor weakens further, the stagflation read is locked. If goods inflation cools meaningfully, Warsh has more flexibility in his opening months than this NFP suggests. These 48 hours are the most consequential inflation read of the cycle.
-
Watch household survey internals in the May NFP (June 5). Fresh unemployed and part-time-for-economic-reasons are the leading-edge distress indicators. If May extends April’s moves at anywhere near the same pace, the labor market has tipped from soft to deteriorating, and Warsh’s first FOMC will not have a steady labor backdrop.
-
AHE year-over-year stopped falling in April. March was 3.5%, April is 3.6%. The wage deceleration that supported the soft-landing thesis through Q1 has paused. If May extends the YoY rate higher, the Fed loses its primary wage-side argument for tolerating slower growth.
-
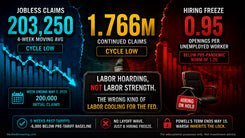
Initial jobless claims become the highest-frequency check between now and June 5. Fresh-unemployed +358K in April is consistent with a meaningful pickup in weekly claims into the May data. A 4-week moving average breaking above 250K would confirm the deterioration. Below 240K would say April was noisier than it looks.
-
Information sector losses are the AI-displacement signal. Down 342,000 (-11.0%) from peak and accelerating. Sectors with high AI-displacement exposure — software, telecom, business services, consumer-facing tech — carry a structural labor-cost story that doesn’t show up in cyclical labor data. Watch payroll counts in these categories specifically.
-
Rate-sensitive equities and long-duration Treasuries get pulled in opposite directions. Wage softness supports rates pulling lower (constructive for duration). Stagflation framing supports rates staying higher for longer (against duration). The 10-year reaction was mixed on May 8 for exactly this reason. The CPI and PPI prints this week resolve the positioning.
Historical Context
The 12-month sum through April 2026, post-benchmark revision, is the cleanest read on the cycle. BLS’s framing — “little net change over the prior 12 months” — captures it more precisely than any rolling average can. Through the trailing year, single prints have ranged from -156K (February) to +185K (March), with the median monthly print clustered in the +20K to +75K range. The post-benchmark 2025 annual employment total came in at +181,000 for the entire year, an average of roughly +15,000 per month.
That base rate is what makes April’s +115K a “beat.” Against a healthy historical trend, it is a deceleration. Against the cycle the U.S. economy has actually been running for fifteen months, it is above average. The distinction matters when interpreting Fed reaction functions: the Fed is not benchmarking against pre-pandemic norms. It is benchmarking against the flat 12-month trajectory in front of it.
The closest historical parallel is the mid-1990s soft-patch period, when the Fed faced cooling labor combined with capacity-side inflation pressure. That cycle ultimately resolved with the Fed holding restrictive policy through the labor weakness rather than cutting into it. Warsh has cited that era in prior speeches. It is the most relevant analog for the data set he is about to inherit.
Bottom Line
The April NFP delivered a +115,000 headline that beat consensus and a household survey that quietly added 803,000 Americans to fresh labor distress in the same release. BLS framed the 12-month payroll picture as “little net change.” Wages came in below consensus but stopped decelerating year-over-year. All three Fed-watched labor indicators — NFP, ISM Manufacturing Employment, ISM Services Employment — now point the same direction.
This is the labor side of stagflation, confirmed across the entire economy in the same month that ISM Prices indices printed at four-year highs. Powell hands the report to Warsh on Friday.
That’s the print that ends one Fed era and opens the next.
Source: U.S. Bureau of Labor Statistics — The Employment Situation, April 2026 (USDL-26-0687, released May 8, 2026)
This article is published for educational and informational purposes only. Nothing contained herein constitutes investment advice or a recommendation to buy or sell any security. Please consult a qualified financial professional before making any investment decisions.
Trading involves substantial risk. All content is for educational purposes only and should not be considered financial advice or recommendations to buy or sell any asset. Read full terms of service.