GAME PLAN REVEALED: 07/16/2025

This morning on GAME PLAN, Gareth Soloway, Chief Market Strategist at Verified Investing, broke down fresh PPI data and showed how it’s reshaping the equity landscape. From a key S&P 500 trend-line test to the first major semiconductor earnings hit, plus critical levels in crypto and commodities—today’s analysis reveals the precise setups traders need to watch. Below, we unpack the day’s top themes, expand on technical and historical context, and highlight the psychological edge that separates high-probability trades from false breakouts.
1. Producer Price Index Sets a Bullish Tone
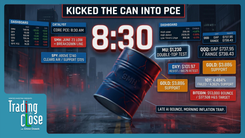
This morning’s Producer Price Index (PPI) print came in well below expectations, reinforcing the disinflation trend:
• PPI month-over-month: 0.00% vs. 0.2% expected
• PPI year-over-year: 2.3% vs. 2.5% expected
• Core PPI month-over-month: 0.0% vs. 0.2% expected
• Core PPI year-over-year: 2.6% vs. 2.7% expected
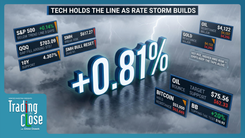
“These numbers across the board are very positive for inflation,” Gareth noted, underscoring that producer-side costs remain contained despite 10% tariffs on most imports. Lower PPI reduces Fed rate-hike risk and gives equities a lift—S&P futures rallied from yesterday’s close at 6,282 to trade near 6,295, equating to about a $1.30 gain on the SPY.
Historical Context
When producer prices decelerate, it typically precedes moderation in consumer inflation by one to two quarters. The early 2000s saw a similar PPI-CPI lag: as commodity pressures eased, broader inflation cooled, supporting a multiyear equity advance. Today’s PPI beat mirrors that dynamic and sets the stage for further gains—provided economic activity holds up.
Trader Takeaway
Positive inflation surprises often spark initial rallies. The question is whether buyers can sustain those gains, especially as technical resistance looms. Keep an eye on CPI follow-through and any Fed commentary, but for now, PPI is a clear catalyst for a modest equity bounce.
2. S&P 500 at a Crossroads: Confirmed or Fake-Out?
On the daily S&P 500 chart, three trend lines converge into what Gareth calls a “mammoth zone of resistance.” After gapping higher on better CPI news and NVIDIA chip-export relief, the index failed to extend and instead drifted sideways. Yesterday’s close beneath the April–June trend line signaled a loss of upward momentum.
“When you see a market open higher on good news and then reverse back down, that is a change in character,” he explained, highlighting institutional selling into strength.
Line-in-the-Sand Breakdown
The April 2025 low established a key support trend line that January 2024 had first drawn. On July 15, the S&P closed below that line for the first time, but without a lower close today, it remains a non-confirmed breakdown. Gareth emphasizes:
• Non-confirmed breakdown: ~50% chance of a true reversal
• Confirmed breakdown (close below yesterday’s low): ~80% chance of sustained downside
Psychology of Confirmation
Fake-outs prey on traders who chase breakouts or breakdowns without waiting for confirmation. Historical episodes—such as the 2022 post-Fed-pause whipsaws—show that institutions often trigger faux breaks to flush positions before resuming the primary trend. By requiring a follow-through close, traders tilt probabilities in their favor.
Trader Takeaway
Watch today’s close. A settlement below yesterday’s low shifts the odds markedly toward further S&P weakness. Until then, a return above the pink April–June line would negate the bearish setup and maintain the bull-market base camp.
3. Nasdaq Resistance and Semiconductor Earnings
While the S&P stalled, the Nasdaq 100 (QQQ) similarly tagged a parallel trend line drawn from the COVID low through recent highs. Yesterday’s gap above that line failed to hold, reinforcing resistance near current levels.
“The NASDAQ came in flat after a failed fake-out above the parallel,” Gareth observed.
ASML: First Major Chip Earnings Stumbles
ASML, Europe’s semiconductor equipment leader, was the first to report. Despite beating current estimates, its guidance warned of a slowdown. Shares plunged about 7.5% in pre-market trading, opening near chart lows. Key levels to monitor:
• Gap fill level at $705.75
• Rising support trend line near $677
Taiwan Semiconductor Preview
ASML’s underperformance raises questions for Taiwan Semiconductor (TSM), which reports tomorrow morning. TSM sits at all-time highs and has double-topped—another classic setup where guidance will dictate whether chips extend or reverse. Weak forecasts could cascade through the sector.
Historical Context
Semiconductor earnings have often been early indicators of tech cycles. In 2018–19, chip capital-spending contractions foreshadowed a broader market pullback. Conversely, 2020’s chip boom led the 2021 tech rally. ASML’s caution now could signal a cooling cycle, especially if TSM confirms softness.
Trader Takeaway
Use ASML’s gap fill and trend-line support as intra-day references. Position sizing should reflect heightened volatility ahead of TSM’s report. A bearish TSM guide likely ignites broader tech selling, while any upside surprise could validate the breakout above QQQ’s parallel.
4. Hidden Trend Lines: AMD’s Retrace to the “Scene of the Crime”
Sometimes the most powerful trend lines go unnoticed. AMD illustrates a “hidden” support-turned-resistance:
• Trend line connecting January, March, and June lows
• Price broke down, then retraced precisely to $158.60 yesterday
“We call it a ‘retrace to the scene of the crime,’” Gareth quipped, noting AMD’s rejection at that level.
Technical Insight
Hidden trend lines often align with institutional order flow because they represent multi-timeframe pivot points. AMD’s failure to clear $158.60 after retesting confirms sellers view that level as a supply zone. Traders can short against rigid stops just above for measured risk.
Trader Takeaway
Identify and trade hidden lines on leading stocks. AMD’s precise retrace offers a clear short entry with limited risk. Watch for volume confirmation: light retest volume suggests a weak bounce and higher odds of continuation downward.
5. Intermarket Dynamics: Dollar, Yields, and Financials
The U.S. dollar (DXY) has broken above its long-term downtrend and currently trades near 100. While stronger on a safe-haven rotation, dollar dominance faces secular headwinds from rising debt and global diversification efforts.
The 10-year Treasury yield kissed 4.5% yesterday but eased slightly on today’s PPI relief—another positive for rate-sensitive assets.
Bank Earnings: Rich Valuations vs. Slow Growth
Goldman Sachs and Bank of America reported solid results, yet their stocks barely budged. As Gareth pointed out, “Financial firms do not have growth rates to justify P/E ratios of 30–50.” Even with healthy net interest margins, banks face valuation pressure once rate hikes pause and earnings growth plateaus.
Historical Context
In late 2006, bank earnings peaked before the credit crisis despite rising rates. The market sniffed out stagnating ROE and compressed valuations. Today’s lofty bank multiples echo that dynamic, warning of limited upside absent new catalysts.
Trader Takeaway
Monitor the dollar for spillover into commodities and equities. Watch 10-year yield moves as a barometer for financials. With rich valuations, bank stocks warrant cautious exposure—favor those with structural advantages or superior capital returns.
6. Crypto at a Critical Juncture: Bitcoin vs. Ethereum
Bitcoin’s weekly chart shows a topping tail two days ago—a bearish reversal pattern. It tested but has yet to confirm a close below the multiyear trend line dating to 2017. Gareth cautioned: “A close above is great, but we need a confirmed move on the weekly to validate a breakout.” Failure to hold suggests greater downside risk.
Ethereum, by contrast, broke out on the daily chart while Bitcoin faltered. Key targets and pivots:
• Near-term resistance: $3,450–$3,500 (high pivots retested)
• Secondary pivot: $3,735
• Major target: $4,100 (double top of 52-week high)
Historical Context
In past cycles, Ethereum led during initial crypto recoveries, then Bitcoin followed. If this pattern holds, ETH’s strength could presage renewed BTC upside—provided weekly confirmation. Traders should watch the correlation: divergence often precedes a catch-up move.
Trader Takeaway
Use the weekly trend line on Bitcoin for position bias. On Ethereum, scale into strength above $3,500 with tight stops—targeting $3,735 and then $4,100 for nimble gains. If BTC breaks down, even Ethereum’s rally could fade.
7. Commodities Round-Up: Gold, Silver, Oil, Natural Gas
Gold: Dancing along support, gold recently broke a short-term line. Gareth entered a small short, hedging his long-term bullish position. A confirmed breakdown here could retest that support range.
Silver: After rejecting $39, silver holds $37 support. A break would open a slide toward $34.50.
Oil: The bear-flag pattern is resolving to the downside. Watch for a close below the flag with initial support near $63.75—and a potential slide toward $53–$54 if momentum accelerates.
Natural Gas: Grinding higher, with resistance at $3.73. This is the first area to watch for a potential pullback.
Psychological Edge
Swings in commodities often reflect broader risk sentiment. By trading shorter-term patterns (bear flags, support breaks) while maintaining longer-term convictions, traders can hedge exposure and capture volatility profit.
Conclusion: Two Key Levels to Watch
-
S&P Daily Trend-Line Close – A settlement below yesterday’s low confirms a breakdown and shifts the risk toward further declines.
- Semiconductor Catalyst – ASML’s guidance has set the tone; Taiwan Semiconductor’s report tomorrow will determine if the chip sector extends gains or capitulates.
By focusing on confirmed signals, multi-factor technical setups, and sector leadership reports, traders can navigate the current patchwork of inflation data, earnings surprises, and intermarket rotations with greater confidence. Above all, patience and discipline—waiting for confirmation and respecting hidden trend lines—remain the hallmarks of high-probability trading.
Trading involves substantial risk. All content is for educational purposes only and should not be considered financial advice or recommendations to buy or sell any asset. Read full terms of service.