My Trading Game Plan Revealed - 06/04/2026: Broadcom Shock Tests AI Bubble, Tech Selloff and Sector Rotation

The artificial intelligence narrative that has driven markets to dizzying heights is facing its first true stress test. Following a string of highly anticipated corporate earnings, the semiconductor and AI sectors are showing significant cracks. In this morning’s My Trading Game Plan Revealed show, Gareth Soloway, Chief Market Strategist at Verified Investing, broke down the fallout, identified critical technical levels, and examined the deeper macroeconomic forces keeping this market afloat.
Today’s article expands on the critical themes from the show, offering traders and investors a look at the technical setups, historical parallels, and psychological disciplines required to navigate a shifting market environment.
The AI Trade’s Stress Test: Broadcom’s Wake-Up Call
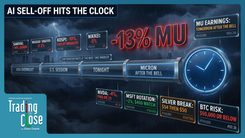
For months, the market has operated under a singular, unshakeable premise: the demand for AI-related semiconductors is infinite, and margins will perpetually expand. Broadcom’s latest earnings report just poured cold water on that thesis. While the company beat on both revenue and earnings, the true catalyst for the ensuing sharp selloff was CEO Hock Tan’s decision not to raise the company’s full-year AI chip sales target.
In a market priced for absolute perfection, flat guidance is treated as a severe downgrade. As Gareth noted during the broadcast:
"We know it's a bubble. The question is, when would it break? The question now we have is, did it start to pop today on this Broadcom news?"
The price action is notable. We are witnessing a $2.2 trillion company dropping roughly 14% in a single session. While retail investors have grown accustomed to seeing mega-cap tech stocks surge by these percentages, a downside move of this magnitude in a company of this size is a major market signal. After closing at $480 yesterday, Broadcom is currently trading down near $406.
From a technical perspective, the breakdown is textbook. Just days ago, a clear trend line connecting pivot tops established formidable resistance. Despite opening above this line for two consecutive days, the stock repeatedly failed to close above it—a classic technical rejection that preceded today's collapse.
For active market participants, this volatility creates distinct opportunities. Day traders should monitor the $395 level, which represents the lowest point of the previous consolidation zone (pivot low to pivot low). If that support fails, a secondary pivot and gap fill wait at the $380 to $381 level.
However, for swing traders looking for a multi-day or multi-week bounce, patience is required. The high-probability swing trade zone sits significantly lower, right around $350 to $355. This area features a beautiful confluence of historical pivot points, sideways consolidation chop, and a critical gap fill.
Infrastructure and Expectations: The Ciena Parallel
To truly understand the current AI infrastructure build-out, we must look back to the dot-com bubble. During that era, companies like Cisco Systems and Nortel built the physical backbone of the internet. Today, companies like Ciena (CIEN) are building the fiber-optic backbone for AI data centers.
Ciena’s earnings were objectively good, but in a momentum-driven market, “good” may not be enough. The stock had rocketed from $85 in August of last year (just 9 months ago) to a staggering high of $640 yesterday. When a stock prices in a utopian future, the earnings report must deliver the impossible.
"I always say when companies rally up hundreds of percentage points going into earnings, they essentially have to cure cancer."
Following the earnings release, Ciena is experiencing a sharp reversion. For day traders, the first technical level of interest sits at $540. Should the selling pressure break that floor, the next key level is $515. Swing traders, however, should exercise caution and look much lower, potentially eyeing the $447 level for a more structural entry point.
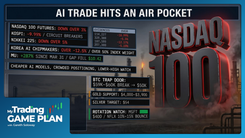
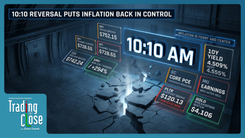
Market Indices at the Brink: S&P 500 and NASDAQ
The broader market indices are reflecting this underlying sector turmoil. The S&P 500 futures (ES) have been chopping sideways since the earnings selloff began, setting up for continued downside pressure.
The technical damage on the daily chart is significant. After an unrelenting, multi-month grind higher, the S&P 500 finally closed below its primary ascending trend line yesterday. The critical battleground for today is the 7,500 level.
Why is 7,500 so important? During this entire two-and-a-half-month rally, the market has only experienced one three-day pullback. That specific pullback created a high pivot, which now serves as the first major line of defense for the bulls. Currently trading about 15 to 20 points away from this zone, the daily close will dictate the near-term trend. If the S&P 500 closes below 7,500, the probability of accelerated downside next week increases dramatically.
Meanwhile, the NASDAQ (QQQ) is fighting its own technical battle. The index remains within a defined parallel channel, having narrowly avoided a close below support yesterday. The line in the sand today is 738. While premarket action showed the QQQ trading 2 points below this level, the "buy-the-dip" algorithmic conditioning in this market is strong. The closing print is all that matters; a confirmed close below 738 signals deeper tech selling ahead, especially with the highly anticipated jobs report looming tomorrow.
The Liquidity Vacuum: Mega-IPOs and Institutional Motives
One of the most profound insights from today's My Trading Game Plan Revealed involves the hidden mechanics of market liquidity and institutional motives. Why hasn't the market suffered a deeper correction yet? The answer may lie in the pipeline of upcoming mega-IPOs.
Wall Street is currently preparing to unleash massive public offerings, including Anthropic, OpenAI, and most notably, SpaceX—a staggering $1.8 trillion IPO.
Large offerings of this scale generally benefit from strong market sentiment, which gives institutions an incentive to maintain a constructive narrative until new supply is absorbed.
Gareth also discussed a recent Alphabet financing headline, framing it as part of the broader scramble to secure capital before a wave of potential mega-IPOs reaches the market. Corporate treasuries recognize the impending liquidity shift these mega-IPOs could create and are moving to raise capital ahead of time. While the AI trade may be showing cracks, institutional forces have a strong incentive to prevent a systemic correction until these IPOs are brought to market.
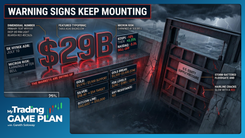
Retail Warnings and Cybersecurity Slips
The economic warning signs extend far beyond the semiconductor space. CrowdStrike, a darling of the cybersecurity sector that benefited massively from the "AI hacking" narrative, is currently down over 10%. The stock hit a brick wall, blowing right through its initial day-trade support at $640 to $641 in the premarket. For traders looking to capitalize on this drop, the next major swing trade level requires patience, sitting significantly lower at a former pivot of $560.
More concerning for the broader economy is the price action in the retail sector. PVH, the parent company of high-end brands like Calvin Klein, is getting crushed by 23% to 25% on earnings.
This is a critical macroeconomic tell. For months, the narrative has been that while lower-income consumers are struggling, the high-end consumer remains robust, driving the economy forward. A 25% haircut in a premium retail brand suggests that economic pain is migrating up the income ladder. Currently trading at $73 and change, traders should watch the $71 level for a potential intraday bounce.
Similarly, discount retailer Five Below is also dropping on earnings, with a key technical pivot point sitting at $184. When both high-end and discount retailers suffer simultaneously, it paints a troubling picture of overall consumer health.
The Great Sector Rotation
A fundamental rule of market mechanics is that capital rarely evaporates instantly; instead, it rotates. As the AI and semiconductor trades unwind, that capital is actively seeking a new home.
"Money doesn't leave the markets initially. It rotates."
We are seeing this rotation play out in real-time. As high-flying chip stocks bleed, Microsoft is catching a bid. This makes logical sense. Microsoft represents the "old trusty" of the tech world. Investors rotating out of volatile AI names aren't looking for another 100% gain in two months; they are seeking the safety of a fortress balance sheet and slow, steady growth.
This defensive rotation is also evident in the broader indices, with the Dow Jones Industrial Average flashing green today as money flows into traditional, defensive industrial names.
Fascinatingly, this rotational behavior is spilling over into the cryptocurrency markets. Bitcoin, which flushed overnight to test a double bottom, is suddenly catching a bid. The sentiment in the crypto space has been overwhelmingly negative over the last few days, creating a contrarian setup. As billions of dollars flow out of semiconductors, beaten-down assets like Bitcoin and Ethereum become highly attractive targets for capital reallocation. In fact, Gareth noted his own strategic entry into Ethereum this morning, playing the probability of a swing trade bounce alongside members of Smart Money Crypto.
Commodities: Gold's Safe Haven Test and Energy Moves
The commodity markets are providing additional clues about shifting global sentiment. Gold is trading higher today, diverging from the tech-heavy NASDAQ. This relative strength begs the question: is gold finally recapturing its traditional safe-haven status in the face of equity market volatility?
Technically, gold is currently sandwiched in a tight battleground between its 200-day and 50-day moving averages. The resolution of this wedge will dictate the next major trend. Upside resistance sits at $4,825; a decisive break through this ceiling could clear the path to new all-time highs. Conversely, the critical support floor is $4,400. If that level fails, the technical structure breaks down, opening the trapdoor for a severe drop toward the $3,500 to $3,600 range.
Silver is also catching a sympathetic bounce today. While the broader chart remains technically damaged, the influx of capital suggests a reversion trade may be underway. Upside resistance for silver is firmly established around $80, with a wide support zone between $66 and $64.
In the energy sector, oil continues to pull back amid swirling, contradictory rumors regarding geopolitical deals. This pullback in energy costs is actually providing a slight cushion for industrial and defensive stocks today. Meanwhile, natural gas is attempting to break out once again, with traders closely watching for a confirmed daily close above the pivotal $3.30 level to validate the move.
Conclusion: Adopting the Casino Mindset
The chaos of earnings season, bubble-like conditions, and sector rotations can easily overwhelm the average investor. The antidote to this chaos is the strict application of technical analysis and probability-based thinking.
As Gareth emphasized at the conclusion of today's broadcast, the goal of a professional trader is not to be right 100% of the time—an impossible feat. The goal is to operate like the casino.
"We want to be the casino. I want to win most of the time. That's the goal."
Casinos do not experience emotion when a player wins a hand at the blackjack table. They simply trust their mathematical edge over a large sample size. By stripping emotion from the equation, identifying precise technical levels, and waiting patiently for the market to come to those levels, traders can build a repeatable process where probabilities, risk management, and discipline matter more than any single outcome.
Whether you are looking to short the breakdown in Broadcom, buy the rotation into Microsoft, or catch the safe-haven bid in gold, disciplined trading requires filtering out the hype and the narratives. In a market where $2.2 trillion companies can lose roughly 14% of their value in a single session, logic, charts, and unwavering discipline are the only true edges a trader possesses. Prepare your levels, manage your risk, and let the probabilities work in your favor.
Trading involves substantial risk. All content is for educational purposes only and should not be considered financial advice or recommendations to buy or sell any asset. Read full terms of service.