Trading The Close Market Recap - 06/22/2026: Yield Breakout Ahead of PCE, Semiconductor Euphoria & High-Probability Trade Setups

Yields Break Higher as Market Divergence Builds Into PCE
The most important signal from today’s Trading the Close was not the modest pullback in the indexes. It was the message underneath the surface.
The 10-year Treasury yield broke higher ahead of this week’s core PCE inflation data, the S&P 500 and Nasdaq showed signs of short-term fatigue, and semiconductors continued to push into euphoric territory even as several major individual names started flashing risk. That combination matters because it creates a market where the headline can still look stable while the internal structure becomes more fragile.
Pro Trader Drew Dosek’s read was clear: this is not a market to chase blindly. It is a market to respect levels, wait for confirmation, and understand which signals are leading.
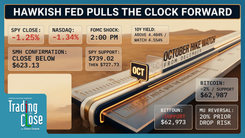
Yields Are the First Signal Into PCE
The week’s main macro event is Thursday’s core PCE report, and the bond market is already leaning into it.
“This does illustrate, as I pointed out at the beginning of the show, inflation is going to be front and center, especially right now in between earnings,” Drew said while reviewing the 10-year Treasury yield.
The 10-year pushed above its recent five-day consolidation range, reaching 4.509% and closing above the June 12 high at 4.505%. It also broke above the horizontal trend line near 4.484%, putting the next resistance area near 4.555% in play.
That is the first read traders need to respect. A higher 10-year yield increases pressure on equity valuations, especially in growth and technology names where future earnings are a larger part of the valuation story. If PCE comes in hot and confirms the move in yields, the market may have less room to ignore the rate pressure that has already started showing up on the chart.
The key point is simple: equities did not just drift lower in isolation. They softened as yields broke higher. That makes the bond market the leading signal heading into the next catalyst.
The Indexes Are Holding, But Momentum Is Thinner
The S&P 500 finished down 0.31%, but the more useful information came from the intraday structure.
The market opened with strength, gapped above last Thursday’s close, and initially looked constructive. Then the tone shifted sharply around 10:10 AM. That failed morning push matters because it shows buyers had a chance to extend the move and could not hold control.
That does not mean the broader trend has broken. Drew’s read was more precise than that. The S&P 500 remains contained inside last Wednesday’s wide range, which means the market is still in a holding pattern rather than a confirmed breakdown. The next directional clue comes from whether price can break above that range and regain upside momentum, or whether sellers press the lower end of the structure and force a deeper test.
The Nasdaq is showing a similar message. The composite remains boxed between support near 25,960 and resistance near 26,511. Until one side breaks, the index is still consolidating.
The QQQ is the cleaner tactical read. Drew pointed out that QQQ has repeatedly tried to reclaim its narrow inclining parallel channel from the Liberation Day lows, but has failed to stay inside it.
“We’ve attempted to get back in this parallel and have since failed. You can see we closed in, closed out, closed out, closed in, then closed out again,” Drew said.
For bulls to regain control, QQQ needs a decisive close above $742.24. Without that, the market remains below a channel it has been trying, and failing, to reclaim.
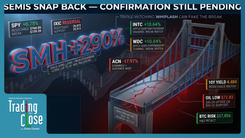
Semiconductors Are the Divergence to Respect
The strongest part of the market remains semiconductors, but that strength is also where the risk is becoming more defined.
SMH pushed to another all-time high, extending a massive move from the Liberation Day lows. That leadership is important, but Drew’s focus was not just on the new high. It was on the exhaustion signal forming at the top of the move.
SMH printed a hanging man candle on the daily chart. A hanging man does not confirm a reversal by itself, but it does show that sellers were able to push price sharply lower during the session before buyers recovered much of the move. At the top of an extended rally, that is a warning signal worth respecting.
Drew pointed back to the prior hanging man candle from June 3. After that candle printed, SMH declined about 13%. That does not mean the same move has to repeat, but it does give the current candle context. When a similar signal appears after an extended move, the follow-through matters.
The key level is the inclining trend line near $639.90. As long as SMH holds above that line, the uptrend remains intact. A break below it would shift the read from simple extension to a potential momentum unwind.
That is the broader market tension right now. Semiconductors are still leading, but they are also stretched. If yields keep climbing and SMH loses trend support, the market’s strongest leadership group could become the area that drives the next risk-off move.
Commodities Show Why Levels Matter More Than Headlines
Oil gave traders a useful reminder today: headlines can move price, but technical levels decide whether that move sticks.
Middle East developments caused crude to gap higher Sunday night, but the geopolitical premium faded quickly. Price reversed lower and moved back into the $75.56 support area. That level now becomes the short-term line to watch.
Oil is also deeply oversold, with the daily RSI near 29.25. That means a technical bounce is possible from this zone, but the level still has to hold. If $75.56 breaks, Drew’s next major downside reference sits near $69.57 at the lower declining trend line.
Natural gas also failed at a key level. After trying to build upside momentum, NatGas rejected near parallel channel resistance at $3.35 and closed back below its inclining trend line. For the bullish read to regain traction, price needs to reclaim the $3.30 area.
The same rate pressure affecting equities is showing up in metals. Gold is testing the lower boundary of its parallel channel from the Liberation Day lows. The level to watch is $4,106. A confirmed close below that channel would open the door to a move toward the psychological area just under $4,000. On any bounce, $4,361 remains the overhead resistance zone.
Silver was also under pressure, but Drew separated the short-term trading read from the longer-term physical accumulation framework. His approach remains patient. He is not chasing strength. He is waiting for price to come back into a lower predefined zone, with sub-$55 and the broader $58 to $50 area standing out as the region where physical accumulation becomes more interesting.
That is one of the most important lessons from the show: professional traders do not need to react to every move. They define the level first, then wait for the market to come to them.
Single-Stock Setups: Netflix, SMCI, Palantir, and Microsoft
The single-stock charts reinforced the same message. This is a market full of sharp moves, but the edge comes from structure, not emotion.
Netflix is one of the more stretched downside charts Drew reviewed. The stock fell 5.82% on the day and has declined more than 30% since April with very little upside relief. That kind of one-way move can become dangerous for late sellers because the eventual bounce can be sharp once price reaches major support.
The key reference is the lower rail of a five-year inclining parallel channel dating back to November 2021. If that channel holds, the first resistance area sits near $86.92. If the channel breaks, the next major support reference is $67.30. The setup is not about guessing the bottom. It is about watching whether buyers defend the long-term structure.
SMCI showed the opposite type of move. The stock jumped more than 15% as it continued to recover from the selloff tied to its recent $7 billion secondary offering. That matters because secondary offerings usually pressure a stock by increasing supply and creating dilution concerns. When price recovers anyway, it shows demand is absorbing that supply.
Technically, SMCI closed near the 50% median line of its parallel channel from July 2025. A daily close above $35.60 would strengthen the bullish structure and open the door toward $42.35. Failure at the median line keeps $31.74 as the next downside support.
Palantir gave a cleaner risk warning. The stock dropped 6.98% and closed below $120.13, a level that had been acting as important support. If price confirms below today’s candle, the bottom of the parallel channel, which sits below $100, becomes the next major downside area to monitor.
The $100 level is also psychologically important. A move into or slightly below that zone could create a flush, but the more important technical point is that $120.13 now becomes the level bulls would need to reclaim to repair the short-term damage.
Microsoft was the biggest-picture warning chart. On the weekly timeframe, Drew highlighted a tentative head and shoulders structure with the neckline near $360. That pattern has not fully triggered yet, but it deserves attention because of the size of the structure.
If Microsoft loses $360 on a decisive weekly basis, the measured move points much lower, with the technical target near $160. That does not mean the move is guaranteed or immediate. It means the risk profile changes if the neckline breaks. Until then, the pattern remains tentative and the level is the message.
Bottom Line: This Is a Market for Confirmation, Not Assumption
The market is not broken, but it is no longer clean.
Yields are breaking higher into PCE. The S&P 500 and Nasdaq are still holding broader ranges, but short-term momentum has thinned. Semiconductors remain the leadership group, but SMH is now extended enough that a hanging man candle deserves attention. Commodities are proving that technical levels still matter more than headline emotion. And individual names are showing both opportunity and risk, depending on whether key structures hold.
That is Drew’s main operator takeaway from today’s Trading the Close: the market is giving traders levels, not certainty.
A hot PCE print could validate the move in yields and increase pressure on growth stocks. A cooler print could relieve some of that pressure and allow the indexes to reclaim their channels. Either way, the next move should be judged by confirmation, not prediction.
The job here is to stay disciplined, respect the levels, and let price prove which side is in control.
Trading involves substantial risk. All content is for educational purposes only and should not be considered financial advice or recommendations to buy or sell any asset. Read full terms of service.