Trading The Close Market Recap - 06/17/2026: Hawkish Fed Triggers Yield Surge, Dollar Rally and Semiconductor Breakdown

Trading the Close Market Recap: FOMC Pressure Hits Stocks, Semis, Gold, and Bitcoin
Today’s FOMC reaction shifted the market from indecision to pressure. Yields broke higher, the dollar rallied, and risk assets faded into the close after Kevin Warsh’s first press conference delivered a calm tone but a hawkish message.
In today’s Trading the Close Market Recap, Pro Trader Drew Dosek broke down the key technical levels now driving the market. The focus is not on the headline alone. It is on whether the S&P, Nasdaq, SMH, gold, silver, oil, and Bitcoin can hold support after a broad post-FOMC risk-off move.
The Macro Catalyst: Inflation Keeps the Fed Restrictive
The key takeaway from the FOMC meeting was the shift in rate expectations. Before the meeting, markets were looking toward a potential hike later in the year. After the statement and press conference, the possibility of an earlier hike moved back onto the table.
“Before the meeting, we were looking at hiking rates in December. And now we’re talking about hiking rates in October,” Drew said.
That shift came from inflation proving stickier than expected. Drew pointed to pressure in housing, food services, recreation services, and super core services. When inflation is embedded in services, it tends to take longer to bring down, which can keep the Fed restrictive for longer.
The market reaction was immediate. Equities sold off, yields pushed higher, the dollar rallied, precious metals weakened, and Bitcoin pulled back. That cross-asset reaction is the setup traders need to respect heading into the next session.
Yields and the Dollar Drive the Move
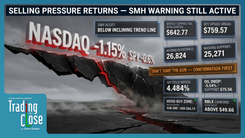
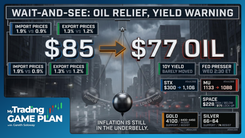
The 10-year Treasury yield broke higher after the 2:00 PM ET FOMC statement, pushing above a key trendline near 4.484%. If that move continues, Drew is watching 4.554% as the next resistance level.
That matters because rising yields pressure growth stocks by increasing the discount rate applied to future earnings. When yields push higher quickly, high-multiple technology and semiconductor names often feel it first.
The U.S. Dollar Index also moved higher after the Fed decision. Drew noted that when the dollar strengthens after FOMC events, it often puts pressure on gold and silver.
Gold pulled back from its recent consolidation range, while silver also weakened. For silver, the near-term issue is whether support can hold. Drew is watching $61.02 as the next support area, with a longer-term accumulation zone potentially developing below $55 and closer to the $50 level.
The S&P and Nasdaq Are Sitting on Key Support
The S&P proxy finished down 1.25%, while the Nasdaq fell 1.34%. The intraday action was classic FOMC volatility: a sharp move lower after the statement, a brief bounce during the press conference, and then renewed selling into the close.
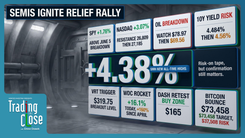
For the S&P, Drew is watching 739.02 as the key support level. A confirmed break below that area opens the path toward the next downside level near 727.73. Hold 739.02, and the market still has a chance to stabilize.
The Nasdaq is also sitting near an important level. It held above the June 12 gap fill at 25,891, but Drew warned that repeated tests of support weaken the level over time.
“Every time we hit, whether that’s a support level or a resistance level to the upside, every time we hit this, it weakens the levels,” Drew said.
If 25,891 breaks, the next downside area to watch is the top of the broader parallel channel. That would tell traders buyers are starting to lose control of the near-term structure.
Semiconductors Remain the Market’s Key Tell
The semiconductor sector remains one of the most important reads for the broader market. SMH has been a major leader during the AI-driven rally, but the chart is now showing stress.
“If we start breaking this inclining trendline, then that could spell some trouble for the high-flying tech names,” Drew warned.
SMH has now closed below a major inclining trendline for a second straight session. That line has been tested several times since March, and each test makes the level more vulnerable.
The key level Drew is watching tomorrow is $623.13. A daily close below that low would strengthen the breakdown signal and put more pressure on the broader tech trade.
The weekly chart also matters. SMH currently has a topping tail in place, and with markets closed Friday for Juneteenth, the weekly candle closes Thursday. Unless SMH can recover above that topping tail, the weekly chart will carry a bearish reversal signal into next week.
STX, WDC, and MU Show Reversal Risk
The weakness in semiconductors is also showing up in individual names.
Seagate (STX) and Western Digital (WDC) both printed large topping tails. A topping tail forms when price pushes higher intraday but sellers take control before the close. It is often a warning that supply is starting to overwhelm demand.
For STX, Drew is watching $1,097. A daily close above that level would negate the topping tail. Until then, downside targets remain near $1,011 and then $931.
For WDC, the key negation level is $729.92. A daily close above that level would invalidate the topping tail. Without that close, the reversal risk remains in play.
Micron (MU) showed a different reversal signal: a bearish engulfing candle. The stock opened above the prior session’s range, trapped breakout buyers, and then reversed lower through the previous candle body.
Drew noted that MU has shown similar reversal structures before, including a prior hanging man candle that led to a sharp decline. If MU continues to confirm below recent lows, the chart could open the door to a deeper pullback, potentially toward the sub-$870 area.
Oil Breaks Support, but RSI Is Oversold
Crude oil also weakened, putting in its first daily close below the $75.56 support level since March 3.
That is a bearish technical development, but Drew warned against getting too aggressive after the move. Daily RSI has now crossed below 30, putting oil in oversold territory.
Oversold does not mean price has to reverse immediately. Oil could still flush toward the next trendline support near $69.83. But the lower RSI reading means traders should be alert for sideways consolidation or a sharp technical bounce that works off the oversold condition.
Bitcoin Tests Support
Bitcoin also pulled back after the FOMC decision, falling roughly 2% and testing near-term support around $62,987.
Drew said a minor pierce of the $63,000 area could still produce a reflexive bounce back above $65,000. But if that support zone fails completely, the larger head and shoulders pattern becomes the bigger concern.
The measured move on that pattern points to a possible target below $40,000. For longer-term investors, Drew said he would begin scaling into Bitcoin below $50,000 and continue averaging toward the $40,000 target zone if the pattern plays out.
The Bottom Line
Today’s FOMC reaction put the market on watch. Stocks sold off, yields broke higher, the dollar rallied, gold and silver weakened, Bitcoin pulled back, and semiconductors showed more technical stress.
The key levels now matter more than the headline. For the S&P, that level is 739.02. For the Nasdaq, it is 25,891. For SMH, it is $623.13. For Bitcoin, it is $62,987.
Hold those levels and the market can stabilize. Lose them on confirmed closes and downside pressure builds. The market is not broken, but the AI-led rally is now facing a real test from sticky inflation, rising yields, and a Fed that may stay restrictive longer than traders wanted.
Trading involves substantial risk. All content is for educational purposes only and should not be considered financial advice or recommendations to buy or sell any asset. Read full terms of service.