Trading The Close Market Recap - 06/16/2026: Market Selloff, SMH Trendline Break & BRB Trade Setups Ahead of FOMC

Trading the Close Market Recap: FOMC, OpEx, SMH Weakness, and the BRB Setups Drew Is Watching
Markets sold off into the close as traders positioned ahead of two major catalysts: the Federal Reserve meeting and monthly options expiration. In today’s Trading the Close Market Recap, Verified Investing Pro Trader Drew Dosek broke down the key levels across the indices, semiconductors, commodities, crypto, and several individual trade setups.
The theme was clear: this is not a market to chase. With FOMC language coming tomorrow and OpEx on Thursday, confirmation matters more than prediction. The charts are giving clear levels, but traders need to wait for daily closes before treating any move as confirmed.
FOMC and OpEx Create a Volatile Backdrop
Drew opened by pointing to the two events shaping this week’s tape.
“We got the Federal Reserve meeting that will be taking place tomorrow, plus we have options expiration happening on Thursday. So some of the selling pressure we saw today could be attributed to options expiration,” Drew noted.
OpEx weeks are known for erratic price action, failed moves, and sharp reversals as market makers adjust around key strike prices. Add a Federal Reserve meeting to the mix, and it makes sense that high-beta names saw pressure into the close.
The key takeaway is not to overreact to one session. The next clean signal comes from how price responds after the Fed and whether today’s selling confirms with follow-through.
S&P 500 and NASDAQ Hold Above Key Support, But Pressure Is Building
The S&P 500 finished down 0.6%, trading below yesterday’s range and fading through the session. The important support level remains the inclining trend line near 738.83. That is the level bulls need to defend to avoid a deeper breakdown.
To the upside, the S&P 500 still needs to clear the inclining trend line near 759.57 before the chart can regain upside momentum.
The NASDAQ was weaker, falling 1.15% on the day. Drew highlighted support near 25,271, with upside resistance at the inclining trend line near 26,824. Until price clears resistance or loses support, the index remains trapped between those two levels.
The 10-year yield remains a major piece of the equity setup. Drew pointed to the 10-year consolidating below resistance near 4.484%.
“You want to see this 10 year start breaking the lows that occurred both yesterday and today. That will help alleviate pressure on the markets if we get the 10 year to come down,” Drew explained.
If yields roll over, that could relieve pressure on tech and growth stocks. If the 10-year pushes higher through resistance, it increases the risk that the indices test their lower support levels.
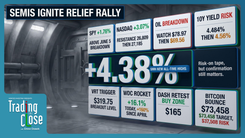
SMH Is the Key Market Tell
The most important chart from today’s recap may have been semiconductors. Drew has consistently treated the SMH ETF as a leading indicator for the broader market, especially tech.
“I’ve told you guys many times, it’s a leading indicator,” Drew said.
SMH closed below an important inclining trend line that has guided the move from the March 30th lows. That does not fully confirm the breakdown yet, because SMH has pierced this line before and recovered. The confirmation comes if SMH closes below today’s candle in the next session.
That would turn today’s weakness into a confirmed trend line break and raise the risk of broader market follow-through to the downside.
The weekly chart adds weight to the warning. SMH is still trading below the weekly topping tail from the week of June 1st, with the high at $642.77. Until SMH can close above that level on a weekly basis, that topping tail remains a major resistance signal.
The BRB Setup: Breakout, Retrace, Bounce
One of the main education points from today’s show was the BRB setup: breakout, retrace, bounce.
The idea is simple. Instead of chasing a breakout after price has already stretched higher, Drew waits for the breakout to confirm, then looks for the retrace back into the broken level. If that level holds, the bounce often gives a cleaner entry with better risk.
HOOD: The Cleanest BRB Example
Robinhood is one of the clearest examples Drew highlighted.
HOOD recently broke out of a large declining parallel channel that dates back to its October all-time highs. After the breakout, price ran into resistance at $101.63 and has now started to pull back.
“Price when it breaks out of declining parallels, it likes to retrace and then catch a bounce from that point and go up higher than the first level of resistance,” Drew explained.
The buy zone Drew is watching begins below $89, with an additional level near $84.73. The invalidation is clean: a daily close back inside the declining parallel channel.
That is what makes the setup attractive. The trade is not based on chasing strength. It is based on waiting for price to come back into a defined area where risk can be managed.
BE and RBLX Still Need Confirmation
Drew also used BE and RBLX to show why confirmation matters.
BE closed at $280.88, pushing above a declining trend line. But Drew made it clear that one close is not enough. The stock needs a daily close above $297.97 to confirm the breakout. If that happens, the next phase is not to chase. It is to wait for the retrace.
RBLX also had a constructive close, finishing above the prior pivot area at $48.43. The next confirmation level is $49.66. A daily close above that level would confirm the breakout and make a pullback toward $48.43 more interesting as a potential BRB entry.
If confirmed, Drew is watching the next declining trend line near $53.92 as the upside target. The base that matters underneath is near $43.38, where RBLX repeatedly found support.
The lesson across both names is the same: let the chart confirm first, then wait for the higher-probability entry.
Apple Forms a Bear Flag
Apple showed the opposite side of the market.
After a sharp move higher earlier this month, AAPL never gave a clean retrace. Now the stock is breaking back down inside its parallel channel and forming a near-term bear flag.
For bulls to regain control, Apple needs to reclaim $302.64 and then attack the inclining trend line near $313. If price rejects instead, downside support sits at $288.62, followed by $281.55.
This is the kind of chart where chasing the earlier breakout carried risk. Without a retrace and hold, the move became vulnerable to failure.
Bitcoin Holds Near-Term Support, But the Bigger Pattern Remains Bearish
Bitcoin was down nearly 1% and is trying to bounce from the lower boundary of a parallel channel and an inclining trend line near $74,500. The weekly candles have shown lower wicks, which points to some near-term buying pressure.
But Drew also emphasized that the larger head and shoulders pattern is still intact. Until Bitcoin can reclaim its key inclining trend line, the larger measured move remains below $40,000.
That creates two different timeframes. Bitcoin can bounce in the short term while still carrying a bearish larger structure. Traders need to know which timeframe they are trading.
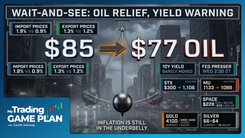
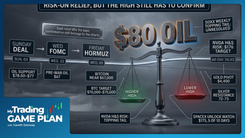
Oil Tags Support as Geopolitical Risk Remains in Play
Oil fell 5.54% and tagged Drew’s predefined support level at $75.56 before catching a late bounce. On the shorter-term chart, Drew noted the potential for a cup and handle or inverse head and shoulders setup, which could support a near-term bounce.
The daily RSI is also moving toward oversold territory, adding to the possibility of relief.
The next upside resistance sits at $86.26. If oil loses support and the bounce fails, the next major level is the declining trend line near $69.56.
Geopolitical headlines remain important here, but Drew’s read stayed level-based: support held today, resistance is clear above, and the next move depends on confirmation.
Gold and Silver Retrace Into Resistance
Gold and silver are showing the opposite version of the BRB setup: breakdown, retrace, and potential continuation lower.
Gold gained 0.56%, but the bounce took price back into resistance at the bottom of the broken parallel channel near $4,421. That makes this a test of former support now acting as resistance.
Silver is in a similar position. After breaking down from an inclining trend line, price is retracing into resistance near $73. If silver reclaims that trend line, it still faces another resistance level at $75.33.
For both metals, the bounce is not enough by itself. Bulls need to reclaim broken structure before the chart improves.
Natural Gas Shows Why Daily Closes Matter
Natural gas was one of the better examples from today’s show of why Drew waits for confirmation.
NatGas had been sitting on an inclining trend line long enough to look vulnerable. But the breakdown never confirmed. Instead, lower wicks developed on the daily candles, and price pushed back into the inclining pennant.
“I highlighted that fact that yeah, the more we hang on down here, it starts forming a bearish pattern looking like it could go down but then we started to develop these wicks at the bottom of these daily candles plus we didn’t confirm the breakdown,” Drew said.
Now NatGas is back inside the pattern and faces resistance near $3.34, which lines up with the bottom of a parallel channel.
The takeaway is simple: an intraday break is not the same as a confirmed breakdown. The daily close matters.
What Drew Is Watching Next
The next session matters because several charts are sitting at decision points.
SMH needs to prove whether today’s trend line break is real. The S&P 500 and NASDAQ need to defend support while yields test resistance. HOOD is moving toward a cleaner BRB retrace zone. BE and RBLX need confirmation before becoming actionable. Apple is at risk of bear flag continuation. Gold and silver are testing former support as resistance.
Drew also pointed out topping tails in several high-flying names, including MU, SNDK, and STX. These have been major winners, and bearish reversal candles in leadership names deserve attention.
The message from today’s Trading the Close was not that traders need to force action. It was the opposite. This is a confirmation market. With FOMC and OpEx in the same week, the best setups are the ones with clear levels, clean invalidation, and enough patience to let the chart prove itself.
Trading involves substantial risk. All content is for educational purposes only and should not be considered financial advice or recommendations to buy or sell any asset. Read full terms of service.