My Trading Game Plan Revealed - 06/15/2026: US Iran Deal Sparks Risk On Rally Oil Falls Fed Relief S&P Megaphone

The geopolitical landscape shifted materially over the weekend, altering the near-term macroeconomic backdrop ahead of a week that was already crowded with catalysts. The confirmation of a US-Iran agreement aimed at reopening the Strait of Hormuz has sent equities higher, pulled commodities lower, and given the Federal Reserve an easier hand heading into its June 16–17 meeting — the first chaired by Kevin Warsh. In this morning's My Trading Game Plan, Gareth Soloway, Chief Market Strategist at Verified Investing, broke down how these macro developments are translating into actionable technical setups across indices, tech, commodities, and crypto.
The Macro Catalyst: Geopolitics and the Federal Reserve
The weekend announcement establishes a 60-day window for nuclear program negotiations and, critically, aims to reopen the Strait of Hormuz by Friday. Oil has pulled back toward $80 a barrel — a psychologically and economically significant threshold — and the market has responded with a broad risk-on move.
Gareth viewed the timing as meaningful: "I don't think it's a coincidence that a deal, or a deal as I like to say, was pushed through just days before the Federal Reserve decision. Because now, all of a sudden, with oil down to about $80 a barrel, the players on the FOMC won't feel the pressure to push for a rate hike."
Kevin Warsh, sworn in as the 17th Fed Chair on May 22, leads his first FOMC meeting this week. The Fed funds rate currently sits at 3.50%–3.75%, unchanged across three consecutive meetings, and as of Monday morning, approximately 97% of futures market participants expected no change at Wednesday's decision, according to CME FedWatch. The more consequential event will be Warsh's press conference — his first public statements as chair on inflation, the rate path, and the Fed's communication posture, which he has signaled he intends to reshape.
Falling oil prices have meaningfully reduced the immediate inflation pressure surrounding the decision and may allow Warsh to maintain a less hawkish tone — removing one potential headwind for equities while the market digests a crowded week of macro catalysts.
The 10-Year Yield's Warning Sign
Despite the bullish equity reaction, the bond market is carrying a signal that warrants attention. The 10-year Treasury yield is currently forming what Gareth characterizes as a bullish flag pattern, right on a major trendline. After testing resistance four times, the yield broke out and has since pulled back twice to retest the trendline.
Even with oil down roughly $5 on the day, yields are only fractionally lower — a notable divergence.
"As long as we stay above this trendline, this is actually a bullish flag pattern in process. And so what we can see is a pattern that could be signaling rates going higher," Gareth explained.
The two-path setup is clear: if the 10-year breaks below this trendline, rates could fall further and add fuel to the equity rally. If the bull flag resolves to the upside, rising yields could renew pressure on growth stock valuations and broader equity multiples. Both scenarios remain live until the yield proves a direction.
S&P 500: The Megaphone Pattern Emerges
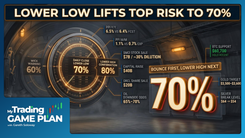
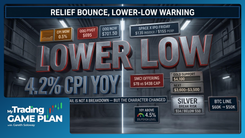
The S&P 500 is opening sharply higher, with futures hovering in the 7,550 to 7,575 range. But the gap-up requires technical context. The broader market recently printed a lower low — the first since the late-March bottom. In Gareth's framework, a lower low represents stage one of a potential trend change.
To confirm a top, the market must also print a lower high (stage two). The central question for this week is whether the current rally stalls to form that lower high, or pushes to new all-time highs.
If the S&P pushes to a new high despite the recent lower low, it creates a specific formation: the megaphone pattern, also called a broadening formation.
"Essentially, it's what's called a megaphone pattern here, where this is exactly what we could be doing. So we could be having bigger dips, but also new all-time highs tagged," Gareth explained.
A megaphone pattern signals high volatility and conflicting market psychology. The structure technically remains an uptrend, but a more chaotic and less reliable one than a traditional sequence of higher highs and higher lows. Traders in a megaphone environment need to remain agile, as violent swings in both directions are characteristic of the pattern.
Tech and Semis: Critical Technical Junctures
The iShares Semiconductor ETF (SOXX) Weekly Topping Tail
A few weeks ago, SOXX printed a weekly topping tail — a candle with a long upper wick indicating that buyers pushed prices to new highs during the week, only to be overwhelmed by sellers before the close. The pattern is a widely watched warning of possible buyer exhaustion.
The rule for negating the pattern is strict: it requires a weekly close above the high of that topping-tail candle.
"It doesn't even matter if it closes today above that high. It's where does it close on the weekly timeframe. Remember, whatever chart or pattern you're looking at, it must negate on that timeframe, or not just any timeframe. That's very, very important to note," Gareth emphasized.
If SOXX fails to close the week above that high, the bearish signal remains in force regardless of intraday strength.
Nvidia: Divergence and a Developing Pattern
Nvidia, the primary bellwether for the AI trade, is bouncing within a parallel channel. However, while the broader semiconductor index is near its highs, Nvidia is lagging — a divergence worth tracking.
Gareth's chart shows what could be the beginning of a right shoulder formation. If Nvidia bounces here and then curls lower, it would complete a head and shoulders pattern — one of the most widely watched bearish reversal formations in technical analysis. Should it trigger and break the neckline, the measured downside target sits at $176. As always, confirmation is required: the pattern must break the neckline with follow-through before the target carries weight.
Microsoft: Accumulation Signals
Microsoft tells a different story. During its recent correction — a decline from $466 to a low near $384 — the stock consistently printed daily candles with long lower tails closing in the upper half of the daily range. These repeated lower tails suggest buyers have been absorbing selling pressure near the lows, though candle structure alone cannot identify who is buying.
With the stock trading in pre-market around $396 today, Gareth identifies upside targets in the $400 to $405 range, with $410 as the next meaningful level to watch on a continued bounce.
The SpaceX Lockup: What the Prospectus Actually Says
SpaceX is pushing higher this morning, but Gareth pointed to a specific technical and structural level at $175 that warrants careful attention.
"Once we get above $175, I think it has to be 5 out of 10 days above $175 per share on SpaceX. A lockup of insider shares is freed up, and they're allowed to sell," Gareth noted.
Here is the prospectus context behind that level: SpaceX's lockup structure is tiered, not a simple 180-day wall. According to the S-1 filing, insiders can sell up to 20% of their locked-up shares beginning the second full trading day after SpaceX's Q2 earnings report (expected in late July). A separate performance-based tranche allows an additional 10% to be sold early if the stock trades at least 30% above the $135 IPO price — approximately $175.50 — for at least five of the 10 consecutive trading days before that first earnings release. Separate time-based tranches release 7% of eligible shares at 70, 90, 105, 120, and 135 days post-IPO, with a further 28% unlocking after Q3 earnings and the full remainder at 180 days. Elon Musk and certain significant investors agreed to a separate 366-day restriction.
What this means practically: the $175 level that Gareth flagged corresponds to the threshold that unlocks an additional portion of eligible insider shares. Retail buyers pushing the stock above and sustaining it above $175 for the required trading-day count could accelerate the availability of supply from pre-IPO holders seeking to reduce exposure. The bullish narrative surrounding trillion-dollar revenue projections can be real and still coexist with supply mechanics that create overhead pressure at specific price levels. Professional traders track both.
Commodities: Oil, Gold, and Silver
Oil's Technical Reality
Despite the Strait of Hormuz reopening headline, oil is not dropping back to pre-escalation levels near $67. It is hovering around $80, down roughly $5 on the day.
Technically, oil broke down from a wedge pattern, retraced as expected, and is resuming its move lower in line with the chart structure. The first major support sits between $77 and $78.50.
There is also a fundamental floor to consider. During the recent crisis, governments including the US drew down strategic petroleum reserves significantly to prevent an energy price spike. Now that prices are normalizing, lower levels could attract reserve-rebuilding demand from governments and state-linked buyers, potentially providing support near lower price levels.
Gold as a Risk Asset
Gold is up approximately 3% on the day — a counterintuitive reaction for an asset that historically sells off when geopolitical risk resolves. On a risk-on day driven by a peace-deal announcement, traditional safe-haven assets typically lose their premium.
"Gold is a risk asset at this point, which tells me it hasn't bottomed out yet," Gareth explained.
After tagging the $4,100 support level — a former pivot low — gold has bounced toward the $4,400 area, where a confluence of trendlines provides resistance. If price gets rejected at $4,400, Gareth sees the potential for a retest and breakdown below $4,100 in the months ahead. Until the correlation structure shifts — meaning gold moves inversely to equities rather than with them — the longer-term technical posture remains cautious.
Silver's Precision
Silver has responded to its key support zone in the $64 to $66 range with a strong bid, and is now pushing toward major resistance between $72 and $73. Until silver reaches that zone, the chart suggests further near-term upside. The precision of the bounce at predefined support is the kind of behavior that validates technical levels as actionable rather than decorative.
Crypto: Bitcoin and XRP
Bitcoin is approaching $67,000, driven by a defined technical structure. The chart recently printed a strong green thrust candle followed by three inside bars where no red candle closed below the green bar's low — a classic continuation pattern. Gareth drew a parallel to a prior setup that preceded a move to $80,000 to $85,000. The immediate resistance sits near $70,000, which he views as a level that could be tested this week if momentum continues.
XRP has a major descending trendline at $1.25. A confirmed break above that level could open the door to a more significant move. Gareth's framing was characteristically direct: "Listen, I couldn't care less about XRP. I'm a chart trader, right?"
That stance — indifference to the asset, focus on the pattern — captures an important principle. Traders who tie their identity to specific coins or companies trade their beliefs, not the math. Gareth noted he is taking partial profits on Smart Money Crypto positions today, with the intention of reducing exposure more heavily if Bitcoin reaches the $70,000 to $75,000 zone.
Conclusion: Discipline in a News-Driven Market
This week combines a geopolitical catalyst, the first Fed meeting under a new chair, a freshly public SpaceX, and several major technical inflection points across equities, commodities, and crypto. That combination will generate a significant volume of narrative — and significant opportunity for reactive, emotion-driven decisions.
The S&P 500's megaphone pattern defines the two possible paths without requiring a prediction: either the rally forms a lower high and confirms a trend change, or it pushes to new all-time highs and extends the broader structure. The SOXX topping tail must resolve on the weekly timeframe. The SpaceX lockup mechanics are now understood, not speculated about.
By remaining objective, using multi-factor technical confluence, and taking partial profits at predefined levels, traders can approach volatility with clearer risk parameters and less emotional interference. Whether the S&P pushes to new highs or forms a lower high, the chart has already defined the conditions that will strengthen either case.
Trading involves substantial risk. All content is for educational purposes only and should not be considered financial advice or recommendations to buy or sell any asset. Read full terms of service.