My Trading Game Plan Revealed - 06/18/2026: Fed Hawk Shock Reversed by Iran Deal, Intel Apple AI Rally & Sector Rotation

Fed Selloff Erased: The Levels That Decide Whether the Rebound Holds
Overnight headlines revived equities after a hawkish Federal Reserve reaction, but Intel, the S&P 500, Alibaba, Caterpillar, and Bitcoin still face important technical tests.
The market erased much of its post-Federal Reserve weakness overnight, but the rebound did not resolve the larger technical picture.
In this morning’s My Trading Game Plan, Gareth Soloway focused on the tension between headlines and confirmation. The Fed’s hawkish message pressured equities, while subsequent geopolitical and corporate developments helped reverse sentiment before the next session. That reversal restored momentum, but one strong overnight move is not enough to establish a durable bullish trend.
The trader takeaway is straightforward: headlines can move price, but the charts determine whether that move holds.
The Fed Selloff Meets an Overnight Reversal
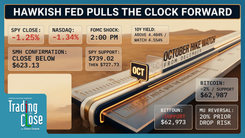
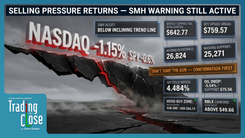
Equities sold off sharply following a more hawkish-than-expected Federal Reserve meeting led by Chair Kevin Warsh. More officials appeared open to rate hikes than the market had anticipated, putting immediate pressure on both the S&P 500 and Nasdaq.
After the close, however, the narrative changed. News surrounding an accelerated agreement between the United States and Iran pushed oil lower, easing some of the inflation pressure reflected in Treasury yields. That helped equity futures recover from the Fed-driven decline.
Gareth viewed the timing as another example of how quickly a dominant market narrative can be displaced by a new headline. Whether that timing was strategic is less important for traders than the reaction it produced: oil declined, yields cooled, and equity futures recovered.
The rebound repaired sentiment, but it did not confirm that the Fed selloff was meaningless. The next several daily closes will determine whether the market establishes a lower high or resumes its advance.
Intel Surges, but $136 Is the Technical Test
The Apple-Intel announcement added another catalyst to the overnight recovery. Intel had already rallied on earlier reports surrounding the partnership, and the official announcement produced another strong move.
That sequence makes Intel a useful example of why traders must separate momentum from entry quality. A stock can continue rising after positive news, but repeated double-digit moves also increase the risk of chasing an extended chart.
Because Intel’s advance spans a long period and involves a substantial percentage change, Gareth shifted to a logarithmic chart. On that scale, a multi-year resistance trendline becomes visible near $136.
That is the level that matters now.
A confirmed break and hold above $136 would clear long-term resistance and strengthen the bullish case. A rejection at the trendline would signal that momentum is running into a technically significant ceiling.
Apple’s response was comparatively muted. The partnership may have greater near-term implications for Intel’s positioning in AI and data-center chips than for a company of Apple’s size.
Key level: Intel resistance near $136
Confirmation: A daily close above $136 with follow-through
Risk: Rejection at the long-term logarithmic trendline
The S&P 500 Still Needs Directional Confirmation
The S&P 500 futures chart reflects the uncertainty created by the sharp selloff and equally sharp recovery.
The decline filled an open daily gap, completing one downside objective. The overnight rebound then returned price toward the prior range before sellers could establish consecutive down sessions.
That leaves the trend unresolved.
For a more convincing bearish shift, Gareth wanted to see sustained selling that clearly established a lower high and continued the sequence lower. Instead, the immediate rebound reduced the clarity of the signal. The Fed decline may still become an important pivot, but it has not yet received enough confirmation.
Quarterly options and futures expiration adds another complication. Expiration sessions can generate unusual volume and erratic intraday movement as large positions are adjusted or settled. Traders should therefore be careful about treating every intraday move as evidence of a lasting change in direction.
The stronger signal will come from where the market closes after the expiration-related activity fades.
AI Strength Is Colliding With Software Weakness
The most important development beneath the major indices is the widening divergence between AI-related hardware and traditional software.
Storage and semiconductor names continue attracting capital. Seagate and Western Digital are trading near record territory, while Micron is approaching resistance around $1,125. The Intel announcement has added momentum to a group already benefiting from enthusiasm surrounding AI infrastructure and data-center spending.
Software is showing the opposite behavior. IBM remains under pressure, while Microsoft has weakened toward major support around $373.
This divergence creates a psychological trap. The strongest stocks attract the most attention, but they can also offer the least favorable risk-reward after becoming extended. Meanwhile, quality companies in abandoned sectors may begin approaching levels where downside risk is easier to define.
“I hate chasing,” Gareth said. “But when everyone else hates something, I’m going to start to like it a little bit more, assuming the fundamentals and technicals align well.”
That does not make every beaten-down software stock a buy. It means traders should compare the risk of chasing AI stocks at resistance with the potential opportunity forming in oversold software names at support.
Caterpillar Approaches Resistance Near $1,000
Caterpillar continues to benefit from the infrastructure spending connected to the AI data-center buildout. These projects require construction, power generation, and heavy equipment, giving Caterpillar indirect exposure to the same investment cycle driving semiconductor demand.
The stock is now approaching an ascending resistance trendline near $1,000. That level has rejected price on previous tests and represents a potential swing-short area if sellers defend it again.
Price has not confirmed a reversal simply by approaching resistance. Traders still need to see a stall, rejection candle, or other evidence that buyers are losing control.
If Caterpillar breaks and closes above the trendline, the short thesis is invalidated. If it rejects the level, the chart could begin another pullback similar to the stock’s previous 10% to 20% corrections.
Key level: Ascending resistance near $1,000
Confirmation: A visible rejection after testing the trendline
Invalidation: A confirmed daily close above resistance
Netflix and Alibaba Test Oversold Support
Netflix is approaching a potential double bottom near $75. A successful hold would show that buyers are defending the prior low and could create the foundation for a rebound.
The pattern remains unconfirmed until price holds the level and begins moving away from it. A decisive daily close below $75 would weaken the double-bottom thesis and open additional downside risk.
Alibaba presents an even more compressed setup. The stock is approaching a gap-fill and prior-low confluence near $104, while its Relative Strength Index is nearing deeply oversold territory.
Oversold conditions alone do not create a buy signal. Stocks can remain oversold while price continues falling. The opportunity comes from the combination of an extreme momentum reading and a defined technical support level.
If Alibaba holds $104 and produces a reversal, the confluence could support a swing-trade bounce. A confirmed close below $104 would invalidate that setup and warn that sellers remain in control.
Netflix level: Potential double bottom near $75
Alibaba level: Gap-fill support near $104
Confirmation: A hold followed by a bullish reversal
Invalidation: A confirmed daily close below support
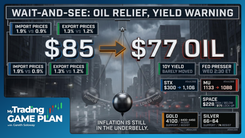
Oil, Yields and the Dollar Shape the Macro Picture
The decline in oil helped drive the overnight cross-asset reversal. Crude pulled back toward $74 and filled a technical gap after news surrounding the U.S.-Iran agreement reduced some of the market’s geopolitical risk premium.
Lower oil prices can ease inflation expectations, which helps explain why the 10-year Treasury yield retreated from its post-Fed spike. That decline in yields provided relief for equities, particularly rate-sensitive growth stocks.
The dollar, however, continues advancing toward major resistance. A stronger dollar often creates a headwind for dollar-denominated commodities, and that pressure is visible in precious metals.
Gold is consolidating inside a developing wedge after Gareth initiated a short position earlier in the week. Silver is showing relative weakness despite the broader rebound in risk assets. That divergence does not confirm a larger breakdown, but it is worth monitoring because silver would normally be expected to participate more strongly in a risk-on move.
Bitcoin Must Hold $63,500 to $63,700
Bitcoin is sitting at one of the clearest decision points discussed during the show.
After producing a bullish reversal and consolidating inside several narrow-range candles, Bitcoin has returned to the breakout area between $63,500 and $63,700. That former resistance zone now needs to act as support.
A daily hold above the range would preserve the bullish breakout structure and keep the recovery intact. A confirmed daily close below $63,500 would represent a failed breakout and materially weaken the near-term bullish case.
Support: $63,500 to $63,700
Bullish confirmation: A daily hold followed by renewed upside
Bearish confirmation: A daily close below $63,500
The Levels That Matter Next
The overnight rebound changed sentiment, but it did not eliminate the market’s technical risks. Intel remains below long-term resistance. The S&P 500 has not confirmed whether the Fed selloff established a meaningful pivot. AI stocks remain extended while software approaches support, and Bitcoin is retesting the level that must hold to preserve its breakout.
The key levels are now clearly defined:
- Intel resistance near $136
- Micron resistance near $1,125
- Microsoft support near $373
- Caterpillar resistance near $1,000
- Netflix support near $75
- Alibaba support near $104
- Bitcoin support between $63,500 and $63,700
Traders do not need to predict which headline arrives next. They need to watch whether price confirms or rejects the levels already on the chart.
Trading involves substantial risk. All content is for educational purposes only and should not be considered financial advice or recommendations to buy or sell any asset. Read full terms of service.