Trading The Close Market Recap - 06/18/2026: Triple Witching Whipsaw: Intel/SMH Rally vs Microsoft Head‑and‑Shoulders

Triple Witching Whipsaw Masks a Growing Split Beneath the Market
The market recovered into the close, but the recovery did not erase the warning signs created earlier in the week.
Quarterly options expiration, shifting Federal Reserve expectations, and surprise technology headlines combined to produce sharp reversals across the major indexes. The Nasdaq recovered its previous-session losses, SPY bounced from trendline support, and semiconductor stocks returned to leadership after reports of a new Apple and Intel partnership.
The headline was resilience. The more important signal was the widening split underneath it.
Semiconductors continue to overpower bearish technical signals, while several major technology names are struggling to hold support. That leaves traders with a market that can still push higher, but one in which index strength is becoming increasingly dependent on a narrow group of stocks.
Triple Witching Complicates the Signal
Quarterly triple witching contributed to the week’s unstable price action. The simultaneous expiration of stock options, index options, and index futures can force market makers to adjust hedges rapidly, producing sharp moves that do not always reflect a lasting change in direction.
“With options expiration, this was a quarterly options expiration today, so triple witching options expiration. And guys, we did have some turbulence this week,” Drew Dosek explained during Trading the Close.
That turbulence was amplified by the news cycle. Markets initially faced selling pressure following the Federal Reserve meeting before technology shares rallied on reports of a new partnership involving Apple and Intel. Additional commentary surrounding memory costs helped lift semiconductor and storage names.
The result was a market repeatedly throwing off technical signals in both directions.
For traders, that means individual candles carry less weight than usual. Confirmation, follow-through, and the ability to hold reclaimed levels will matter more than the initial reaction.
SPY and the Nasdaq Recover, but Confirmation Still Matters
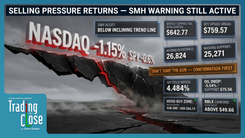
SPY gained approximately 0.78% and recovered much of the previous session’s decline after testing an inclining trendline that has supported the broader advance.
The next upside level sits near $760.86. A sustained move through that area would put the highs back in play. On the downside, $739.39 remains the important support level. A confirmed break below it would damage the near-term structure and suggest that the latest recovery was another expiration-driven reversal rather than the beginning of a durable move.
The Nasdaq Composite produced an even sharper recovery, reversing the previous session’s losses and negating the bearish engulfing candles that had appeared earlier in the week.
“So it’s a lot of whipsaw action, which should be anticipated for options expiration week,” Drew said. “These certainly are throwing patterns one way and then another way and keeping us on our toes.”
Nasdaq resistance sits near 26,873. If the index consolidates near the upper end of its range and clears that level, another run toward all-time highs becomes possible. Support sits near 25,313 at the upper boundary of the prior parallel channel.
The recovery improved the immediate picture, but one headline-driven session does not settle the broader trend. These reclaimed levels now need to hold after expiration pressure clears.
Semiconductors Continue to Defy the Reversal Signals
Semiconductors remain the market’s strongest source of momentum.
The VanEck Semiconductor ETF (SMH) has gained roughly 290% from its April lows. Previous advances of more than 230% since 2021 were eventually followed by corrections of approximately 30% to 40%, making the current extension historically significant.
That does not mean a reversal is immediate. In fact, SMH continues to invalidate signals that would ordinarily suggest one is developing.
The ETF recently printed a large weekly topping tail, only to negate it within two weeks. As Drew noted, a reversal signal on that timeframe would normally take much longer to repair.
“Usually a weekly topping tail, a larger-timeframe topping tail, takes several weeks to negate. It only took two weeks on the SMH. Really remarkable stuff.”
Momentum divergence remains present, but sellers have not converted it into structural damage. The downside trendline near $631.83 is the key level to monitor. As long as SMH holds that area, the sector’s underlying trend remains intact despite its extended position.
Intel (INTC) provided the clearest expression of the semiconductor strength, gaining more than 10% following the Apple partnership reports. The rally stopped at the upper boundary of a large parallel channel extending back to November 2022.
Intel also closed the week above its recent bullish consolidation. A confirmed break above the macro channel would open the door to new 2026 highs. Failure at the channel boundary would keep the stock trapped inside the larger structure.
Other semiconductor-related names are not confirming Intel’s strength as cleanly. Western Digital (WDC) and Applied Materials (AMAT) have printed consecutive daily topping tails, showing continued selling into intraday strength.
That divergence is worth watching. If semiconductor leadership begins to weaken, the indexes will lose one of the primary forces holding them near their highs.
IBM and Microsoft Reveal the Other Side of Technology
The strength in semiconductors is masking considerable weakness elsewhere in technology.
IBM sold off as Accenture (ACN) dropped nearly 18% following its earnings report and forward guidance. IBM had recently rallied back into its parallel channel, but the move was rejected almost as quickly as it developed.
The stock is now testing inclining trendline support near $238.05. Holding that level would preserve the possibility of a bounce toward the bottom of its former channel near $291.25.
A confirmed break below $238.05 would expose a much larger downside gap in the structure. The next major support sits near $198.06, where a March 2024 pivot high converges with the rising 200-week moving average.
Microsoft (MSFT) carries an even larger structural risk. The stock is already more than 30% below its highs and is testing a declining trendline after recovering from its intraday lows.
On the weekly chart, Microsoft is forming a potential head and shoulders pattern. The neckline is defined by an inclining trendline connecting the major lows. A confirmed break beneath it would activate a measured-move target near $157.
That target is not a prediction that Microsoft will fall directly to $157. It defines the risk embedded in the pattern if the neckline fails. Until that confirmation occurs, the formation remains a warning rather than an active breakdown.
The 10-Year Yield Remains the Macro Pivot
The 10-year Treasury yield is consolidating directly beneath resistance at 4.484%.
The near-term consolidation can resolve in either direction because the yield continues to press against resistance. The broader formation, however, still resembles a bear flag.
A downside resolution would ease pressure on equities and could help extend the recovery. A confirmed break above 4.484% would likely tighten financial conditions and create renewed pressure across stocks and commodities.
Precious metals are already reflecting that pressure.
Gold traded below Monday’s green candle, increasing the probability of a test of support near $4,030. Silver’s bounce following its consolidation breakdown also remains weak. Minor support sits near $61.02, followed by more substantial structural support around $55.09.
The key variable is still the dollar and Treasury yields. Without relief from those markets, rallies in gold and silver are likely to remain vulnerable.
Oil and Bitcoin Face Separate Confirmation Tests
U.S. oil traded as low as $72.83 as markets reacted to developments surrounding Iran and the Strait of Hormuz.
Oil is technically oversold on the daily chart and could produce a short-term bounce. If geopolitical conditions remain stable, however, declining trendline support near $69.56 remains a plausible downside destination. A disruption to the agreement would quickly shift attention back toward resistance near $86.26.
Natural gas continues to move sideways after closing beneath an inclining trendline without confirming a larger breakdown. Reclaiming approximately $3.26 would improve the near-term structure, with additional resistance near $3.34 at the bottom of the parallel channel.
Bitcoin is also sitting at a decision point. Price is attempting to hold the lower boundary of its parallel channel after surrendering gains over the previous three sessions.
Weekend trading could produce a bounce because lighter volume gives retail activity greater influence. That would not resolve the larger weekly risk.
Bitcoin’s head and shoulders pattern remains intact. A confirmed break below consolidation support near $57,856 would activate the bearish structure and put the measured-move target near $37,508 into play.
What Traders Should Watch Next
The market recovered, but the character of that recovery matters more than the closing gains.
Expiration mechanics and technology headlines helped reverse several bearish signals, yet the strength remains concentrated. SMH and Intel are pressing against major resistance while IBM, Microsoft, WDC, and AMAT continue to show varying degrees of technical stress.
Heading into next week, three signals carry the most weight:
- Whether SPY and the Nasdaq hold the levels reclaimed during the expiration-driven rally.
- Whether semiconductor leadership expands or begins to break beneath its trendlines.
- Whether the 10-year yield clears 4.484% or confirms the larger bear flag.
The market is still capable of moving higher, but traders should not confuse a sharp reversal with broad confirmation. Let expiration clear, monitor whether the reclaimed levels hold, and allow follow-through to determine whether this was genuine accumulation or another headline-driven whipsaw.
Trading involves substantial risk. All content is for educational purposes only and should not be considered financial advice or recommendations to buy or sell any asset. Read full terms of service.