My Trading Game Plan Revealed - 09/17/2026: Fed Hawkish Shock Sparks Volatility, Yields Oil Bitcoin Technical Setups

The Federal Reserve delivered the hawkish rate decision markets had been preparing for. What matters now is what happened after it.
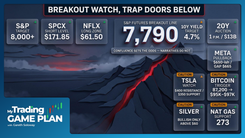
Stocks sold off following Wednesday's 25-basis-point rate hike, yet S&P futures reversed sharply higher Thursday morning. The more useful explanation is not that investors suddenly decided a hawkish Fed was bullish. It is that two of the pressures sitting underneath the equity market, long-term Treasury yields and crude oil, both began moving in a more favorable direction.
That puts the 10-year yield and oil at the center of Gareth Soloway's current market framework. If both continue backing away from recent highs, equities have room to stabilize despite tighter Fed policy. If they turn back up, the pressure returns.
The Fed Was Hawkish. The Long End Did Not Follow
The Fed raised its benchmark rate by 25 basis points Wednesday to a target range of 3.75% to 4.00%. The decision was unanimous, and 16 of 18 policymakers projected at least one additional increase before year-end.
That is unquestionably a tighter policy message.
But the reaction across the Treasury curve matters more for stocks than the headline alone.
The 10-year yield had already pushed into a major resistance area around the October 2023 high, when it briefly traded above 5%. Gareth had been watching that area as a potential double top, and the yield is now backing away from it.
That rejection matters because the long end feeds directly into financial conditions throughout the economy. Mortgage rates, corporate borrowing costs and equity valuations all become more difficult to support as long-term yields rise.
So far, the chart is doing the opposite.
The Fed raised short-term rates, but the 10-year has started retreating from resistance. That divergence helps explain why equities could sell off on the announcement and then reverse higher the following morning.
The technical read remains conditional. Holding below the recent high keeps the rejection thesis intact. A renewed push through the 5% area would materially change it.
Oil Is Reinforcing the Move in Yields
Crude oil is the second piece of the same setup.
WTI surged during the recent escalation in Middle East supply concerns, adding another inflation risk at exactly the wrong moment for bond markets. That move has now started to reverse. On Thursday, WTI fell roughly 3% to around $99 as Saudi Arabia supplied additional crude and concerns about near-term disruptions eased.
The fundamental news arrived at a level Gareth was already watching technically.
Oil had pushed into resistance and has now broken beneath its rising trend line. That puts the next major support area around $92 to $93 back in focus.
The important connection is not simply that lower oil is good for consumers. Energy prices are part of the inflation equation that bond traders are trying to price. If crude continues lower, some of the pressure that drove the 10-year toward 5% begins to come out of the system.
That gives equities two potential tailwinds from the same move: lower energy inflation and lower long-term yields.
The S&P's Breakdown Failed, but the Closing Level Still Matters
That framework helps make sense of the S&P 500.
The index broke beneath its rising trend line during Wednesday's post-Fed selloff, moving into the neutral zone Gareth has been tracking. By Thursday morning, futures had reclaimed the breakdown area and pushed above Wednesday's highs.
That is better described as a failed breakdown than evidence of manipulation.
The distinction matters. A break below support can trigger stops and attract fresh short positioning. When price quickly reclaims that same level, those traders can become part of the buying pressure as the market reverses.
For Gareth, however, one overnight recovery does not erase the level.
The S&P remains constructive while it holds above the reclaimed trend line. A daily close back beneath the critical support area would shift the chart toward neutral again.
Price still has to prove the recovery can hold.
Gold and Silver Are Trying to Negate Their Fed Selloff
The same cross-asset repricing is visible in precious metals.
Gold sold sharply after the Fed decision before rebounding Thursday. Spot gold was up more than 2% during the session as the 10-year yield eased and crude oil fell.
Technically, Gareth is watching the $4,300 area. Holding and closing above that level would strengthen the near-term recovery.
Silver has a different problem. It broke below the neckline of a potential head-and-shoulders formation during Wednesday's selloff and is now attempting to reclaim it.
That makes the neckline the decision point.
Holding below it keeps the bearish pattern alive. A close back above it would weaken the breakdown and potentially trap traders who positioned for continuation lower.
The pattern matters less than what price does with the failed or confirmed break.
Bitcoin Is Holding a Different Structure
Bitcoin did not react to the Fed the same way precious metals did.
That relative resilience comes shortly after the Senate failed to advance the CLARITY Act in a procedural vote that required 60 votes.
Despite that catalyst, Gareth's broader Bitcoin structure remains intact.
The chart is developing what he sees as a bull flag, but the setup still needs confirmation. A daily close below roughly $75,500 would weaken that structure and bring the $67,000 area into focus.
The larger test sits in the opposite direction.
Bitcoin still needs to clear approximately $82,850 to produce the higher high that has been missing from the broader structure. Until that happens, the chart can improve without yet confirming a larger trend reversal.
That makes $75,500 and $82,850 the two levels that define the current range of outcomes.
Individual Stocks: The Timeframe Changes the Trade
The individual-stock setups from Thursday's session reinforce another part of Gareth's framework: the same chart can look completely different depending on the timeframe.
Lennar (LEN) sold off after reporting third-quarter results in which net earnings fell to $284 million from $591 million a year earlier and new orders declined 9%. The early decline pushed shares into Gareth's $71 to $74 support zone, where a descending trend line and horizontal support converge. With long-term yields also retreating, that area remains technically important if LEN comes back to test it.
Intel (INTC) is approaching $106.85, which Gareth sees as the breakout level needed to put the open gap near $122 back in focus.
Dell (DELL) presents the opposite structure. Gareth is watching approximately $607, where an ascending trend line creates potential resistance. A rejection there would strengthen the short-side technical read.
Bank of America (BAC) has sold sharply enough to bring the $56 to $56.90 area into focus as a potential reaction zone. The important feature is the prior pivot structure beneath price, not the size of the decline by itself.
Generac (GNRC) is a reminder that timeframe matters. The company announced a long-term generator supply agreement with Amazon valued at approximately $2.4 billion, producing an enormous move in the stock. Gareth is not treating that extension as a swing setup. Instead, he is watching approximately $241 to $243 as a potential intraday resistance area if the stock reaches it.
That is a different trade thesis with a different holding period.
Nike Is a Contrarian Investment Thesis, Not a Trading Setup
Nike sits outside the short-term trading framework.
Shares have fallen to roughly $36, leaving the stock near levels not seen in more than a decade. Reuters reports that Nike has lost roughly 80% of its market value over the past five years as sales growth, product innovation and competition have weighed on the company.
That is what makes the chart interesting to Gareth from a contrarian perspective.
The thesis is not that a beaten-down stock must rebound. It is that extreme pessimism can create a fundamentally different risk-reward discussion for a patient investor than it does for a trader attempting to catch a short-term bottom.
The weakness is what puts Nike on the radar. It is not confirmation that the bottom is already in.
What Matters Next
The Fed supplied the headline, but the 10-year yield and crude oil are currently supplying the transmission mechanism.
If oil continues backing away from recent highs and the 10-year remains rejected below the 5% area, the equity market has room to absorb a more hawkish Fed without immediately breaking its broader structure. The S&P's recovery above its trend line is the first evidence of that repricing, but it still needs to hold.
That is the hierarchy worth watching now: oil influences the inflation outlook, the inflation outlook influences long-term yields, and long-term yields help determine how much pressure equities can withstand.
The individual setups matter, but those two macro charts are setting the conditions around them.
Trading involves substantial risk. All content is for educational purposes only and should not be considered financial advice or recommendations to buy or sell any asset. Read full terms of service.