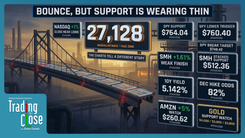
My Trading Game Plan Revealed - 10/19/2026: S&P Bull Flag vs NASDAQ Top How To Trade Mega Cap Earnings and Bond Risks

S&P 500 Holds Support as Nasdaq Weakens: Gareth Soloway's Key Trading Levels for October 19
The market entered the weekend with investors increasingly concerned about a deeper selloff, particularly in technology stocks. Following a difficult week that saw the Nasdaq come under substantial pressure while the S&P 500 held up comparatively better, bearish sentiment intensified. However, when futures trading resumed Sunday evening, the S&P 500 found buyers near a double-bottom support area. That reaction reinforced a key theme in Gareth Soloway's October 19 market analysis: the broader market continues to show technical resilience even as technology leadership deteriorates.
During this morning's My Trading Game Plan Revealed, Gareth Soloway, Chief Market Strategist at VerifiedInvesting.com, examined the divergence between major indices, the growing influence of Treasury yields, and several technical setups across stocks, commodities, and Bitcoin. His framework emphasizes identifying where buyers are defending support, where rallies are encountering resistance, and how traders can use those levels to assess risk as earnings-related volatility develops.
S&P 500 Technical Support Holds as Market Fear Increases
The sharp selling pressure heading into the weekend created an increasingly bearish mood among retail traders. Yet the S&P 500 futures market opened Sunday evening near an established double-bottom support area and subsequently moved higher. Gareth viewed that reaction as an important reminder that elevated fear can create opportunities for technical bounces, particularly when price reaches support that has already attracted buyers.
The distinction comes down to the chart structure and the risk associated with chasing a move after significant selling has already occurred. When a market approaches a well-defined support level amid widespread bearish sentiment, traders need to consider whether the immediate downside has become extended. Support does not guarantee a reversal, but it provides a reference point for evaluating whether buyers are stepping in and whether a potential bounce offers a reasonable risk/reward setup.
October's history also contributes to market psychology, given the major selloffs associated with 1929 and 1987. Gareth discussed the Working Group on Financial Markets, commonly referred to as the Plunge Protection Team, in the context of market stability. The group was established after the 1987 crash to coordinate policy discussions among financial regulators. Its existence should not be interpreted as a guarantee against market crashes or sustained bear markets. For traders, the more immediate evidence remains the price action around established technical levels.
S&P 500 vs. Nasdaq: Bullish Support Meets Weakening Technology Stocks
One of the clearest developments in Gareth's market framework is the growing separation between the S&P 500 and the technology-heavy Nasdaq. The S&P 500 recently tested an ascending trendline connecting multiple important pivot lows and attracted buying interest. That response keeps the broader technical structure constructive, with Gareth continuing to monitor a potential macro bull flag and a longer-term upside objective near 8,000.
The significance of this setup is the ability of the broader index to maintain support despite weakness in several large technology names. Rotation into other sectors can help stabilize the S&P 500 even when former market leaders struggle. As long as the index respects its major rising support structure, the larger bullish scenario remains viable. A confirmed breakdown below that trendline would weaken the setup and require a reassessment of the broader market outlook.
The Nasdaq presents a less constructive technical picture. Gareth has identified a series of lower highs across important AI-related stocks, suggesting that buying momentum has weakened since the sector's earlier peaks. Repeated failures to reclaim previous highs can signal distribution or a developing downtrend, particularly when rallies lose momentum near established resistance. While individual technology stocks may continue to produce strong rebounds, Gareth's analysis favors greater selectivity within the sector.
Intel Stock: Trendline Breakdown Creates a Resistance Test
Intel provides an example of how a positive company headline can intersect with a weaker technical structure. The article's source material describes a JPMorgan upgrade that helped lift the stock, but Gareth's focus remained on a recent breakdown below a major long-term trendline. Once an established support line breaks, a subsequent rally toward that same level can become a test of overhead resistance.
Gareth identified approximately \$102 as a potential resistance area if Intel continues to rebound. A move toward that level could attract selling pressure from traders who view the recovery as a retest of the prior breakdown. However, a sustained recovery above the broken trendline would challenge the bearish interpretation. The important question is whether Intel can reclaim its former support or whether sellers regain control as price approaches that area.
Treasury Yields and US Debt Remain Major Risks for AI Stocks
Beyond individual stock charts, Gareth continues to emphasize the importance of the bond market in shaping the broader investment environment. The 10-year US Treasury yield serves as a benchmark for borrowing costs and influences equity valuations, corporate financing decisions, and investor appetite for risk. Changes in yields can have an especially meaningful impact on companies whose valuations depend heavily on future earnings growth.
This relationship becomes increasingly important within the AI infrastructure trade. Businesses committing substantial capital to data centers, computing capacity, and related infrastructure may face additional pressure when financing costs rise. Gareth highlighted companies such as CoreWeave as examples of businesses where debt obligations and access to capital deserve close attention. Higher borrowing costs can reduce financial flexibility and place pressure on valuations, particularly when investors begin questioning the timing of future returns.
The broader US debt burden adds another layer to Gareth's macroeconomic concerns. Large federal borrowing requirements, interest expenses, and the direction of Treasury yields can influence financial conditions across the economy. Gareth also discussed the US Dollar Index, or DXY, with the 101 area serving as a nearby technical reference. A weaker dollar or temporary easing in yields may provide relief to risk assets, but a sustained rise in borrowing costs could complicate the outlook for heavily leveraged companies and growth-oriented sectors.
Meta, Broadcom and Tesla: Key Stock Levels Ahead of Earnings
With corporate earnings drawing attention to major technology and industrial companies, Gareth identified several chart structures that could become relevant if volatility increases. His approach centers on waiting for price to reach meaningful support or resistance rather than pursuing stocks after an extended move. Earnings can produce sharp gaps in either direction, making technical confirmation and clearly defined invalidation levels particularly important.
Meta Stock: \$683 to \$666 Bull Flag Support Zone
Meta is developing a potential bull flag structure, with Gareth identifying the \$683 to \$666 area as an important support zone. This region brings together prior pivot levels and a significant gap-fill area, creating a potential location for buyers to defend the broader bullish pattern. A pullback toward approximately \$682 could offer a technical setup if price stabilizes and begins showing evidence of renewed demand.
The lower boundary near \$666 provides a reference point for invalidation. A confirmed daily close below that level would weaken the bull flag interpretation and increase the possibility of additional downside. Until then, the structure remains worth watching for traders looking to evaluate a pullback near support rather than chase a rally into earnings.
Broadcom Stock: \$315 to \$316 Fibonacci Support
Broadcom recently tested a support area near \$315 to \$316, where several technical factors converged. Gareth identified a descending trendline, a prior gap-fill level, and the 50% Fibonacci retracement of the relevant price swing. When multiple independent technical references align, they can strengthen the significance of a support or resistance area.
The stock subsequently moved higher, leaving traders who missed the initial test without the same entry conditions. Gareth's framework favors patience in that situation. If Broadcom revisits the \$315 to \$316 zone, the reaction could help determine whether buyers remain willing to defend it. A decisive breakdown would reduce the strength of the bullish setup and suggest that the earlier confluence is no longer providing effective support.
Tesla Stock: Parallel Channel Resistance Near \$400
Tesla remains within a technical parallel channel defined by established highs and lows. Gareth is watching the upper boundary, located just below \$400 in the source analysis, as a potential resistance area if the stock rallies. A move into that region could create an opportunity to evaluate a bearish reversal, particularly if price begins losing momentum near the channel's upper trendline.
The lower boundary offers the opposite scenario. A substantial pullback toward channel support could attract buyers if the structure remains intact and price begins to stabilize. Earnings-related gaps may temporarily move Tesla outside the channel, so the strength of any breakout or breakdown matters. A sustained move beyond either boundary would require traders to update the existing technical framework.
Verizon Stock Rebound Shows Why Technical Support Matters
Verizon provided another example of Gareth's approach to evaluating market reactions during periods of negative sentiment. The stock experienced a sharp selloff amid concerns about potential competition in the mobile communications industry. That decline brought price toward an area where an ascending trendline aligned with a previous resistance level that had become support.
The subsequent rebound illustrated how an established technical level can attract buyers even when the surrounding news narrative remains negative. Traders evaluating the setup had a defined area where the bullish thesis could be tested. A successful defense of support strengthened the case for a recovery, while a sustained break below it would have weakened the trade.
The broader lesson applies beyond Verizon. Large news-driven moves can push stocks into technically significant areas, and those locations may provide opportunities to assess whether selling pressure is becoming exhausted. Gareth's framework emphasizes the quality of the support, the market's reaction at that level, and the amount of downside risk involved if the setup fails.
Gold and Silver Price Outlook: Critical Support Levels
Precious metals are approaching technical levels that could determine their next directional moves. Gareth's analysis of gold and silver reflects a cautious near-term outlook, particularly as recent price action has struggled to generate convincing rebounds from established support. The quality of the bounce is an important part of the assessment because repeated tests of support without meaningful upside follow-through can indicate weakening demand.
Gold Price: \$4,100 Trendline Support and \$3,950 Downside Target
Gold is trading near an important trendline around \$4,100 in Gareth's chart analysis. Although the level has attracted buying interest, the price action has remained relatively subdued. Instead of producing a strong rebound away from support, gold has been consolidating close to the trendline, creating the possibility of a bearish continuation pattern.
A confirmed daily close below \$4,100 would weaken the current support structure and bring approximately \$3,950 into focus as the next downside reference. If selling pressure continues beyond that area, Gareth has identified a deeper potential support zone near \$3,500. Conversely, a stronger rebound that carries gold decisively away from the trendline would reduce the immediate breakdown risk and improve the near-term technical outlook.
Silver Price: \$55 Breakdown Level and \$50 Support
Silver has already shown weakness following a breakdown from its wedge formation. The subsequent rebound appears limited in the context of the original pattern, leaving Gareth focused on whether sellers can push price below approximately \$55. A confirmed break would strengthen the bearish scenario and bring the \$50 area into consideration as a potential downside target.
The technical read would improve if silver recovered above the broken structure and began establishing stronger support. Until that occurs, the existing breakdown warrants attention, particularly given the possibility that weakness in precious metals could extend across related markets.
Crude Oil and Natural Gas: Bearish Oil Targets, Bullish Gas Setup
Crude oil remains under pressure within Gareth's technical framework. He continues to favor a bearish outlook, with approximately \$88.75 identified as a downside objective and \$75 representing a deeper potential target if the larger breakdown develops. These levels are conditional targets based on the chart structure, and any sustained recovery through important resistance would require a reassessment of the bearish case.
Natural gas offers a contrasting setup. Gareth identified a developing bullish wedge, with price recently testing resistance but failing to establish a confirmed breakout. The pattern suggests that buying pressure may be improving, although the technical signal remains incomplete. A confirmed daily close above wedge resistance would strengthen the bullish interpretation, while continued rejection could keep natural gas confined to its existing consolidation.
Bitcoin Price Analysis: \$81,000 Support and \$87,200 Resistance
Bitcoin remains within a defined trading range, with Gareth identifying approximately \$81,000 as critical support and \$87,200 as resistance. Price action between those boundaries leaves the near-term direction unresolved. For traders, the range provides a framework for evaluating potential opportunities while avoiding premature assumptions about which direction the eventual breakout will take.
A confirmed breakdown below \$81,000 would weaken the current structure and bring approximately \$75,500 into focus as a potential downside objective. Alternatively, a sustained move above \$87,200 would improve the bullish outlook and open the possibility of a rally toward the \$95,000 to \$97,000 region. Both scenarios require confirmation, particularly because Bitcoin can produce sharp reversals around widely watched technical levels.
Gareth's broader point concerns the trade-off between entering early and waiting for stronger evidence. Anticipating a breakout may improve the entry price if the move succeeds, but it also increases exposure to failed signals. Waiting for confirmation can mean sacrificing part of the move in exchange for greater clarity about market direction. The appropriate decision depends on the setup, the available risk/reward, and whether price action supports the original trading thesis.
Gareth Soloway's Market Outlook: Key Levels and Trading Discipline
The central theme from Gareth's October 19 market analysis is the divergence between a technically resilient S&P 500 and weakening leadership in technology stocks. That separation creates a more selective trading environment, where broad index strength may conceal weakness in individual sectors. Treasury yields and financing conditions add another source of risk, particularly for companies with substantial capital requirements and debt exposure.
The immediate framework remains defined by identifiable chart levels. The S&P 500's rising trendline will help determine whether the broader bullish structure remains intact. Meta's \$683 to \$666 support zone, Broadcom's \$315 to \$316 confluence, and Tesla's channel resistance near \$400 provide individual equity setups. Gold's \$4,100 trendline and Bitcoin's \$81,000 to \$87,200 range offer additional signals for traders assessing whether current consolidations resolve higher or lower.
The advantage comes from preparing for both outcomes before price reaches a decision point. A support level that holds can provide a defined setup, while a confirmed breakdown changes the trade and the risk involved. With earnings and macroeconomic pressures capable of producing significant volatility, Gareth's framework favors disciplined entries, clear invalidation levels, and patience when the chart has yet to confirm a direction.
Trading involves substantial risk. All content is for educational purposes only and should not be considered financial advice or recommendations to buy or sell any asset. Read full terms of service.