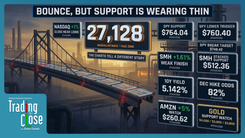
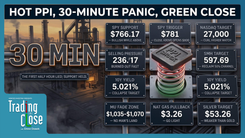
My Trading Game Plan Revealed - 10/20/2026: AI Selloff, CoreWeave Bounce Zone, S&P Risk Between 7450 and 8000

AI Stocks Face a Reality Check as S&P 500, Bitcoin and Gold Test Key Levels
My Trading Game Plan Revealed | October 20, 2026
The artificial intelligence trade is facing a more difficult test as investors begin weighing the cost of AI infrastructure against the earnings needed to support it. In today's My Trading Game Plan Revealed, Gareth Soloway, Chief Market Strategist at VerifiedInvesting.com, examined how weakness in AI-related stocks could influence the broader market, Treasury yields, and investor sentiment. With the S&P 500 approaching important technical levels and Bitcoin and gold showing signs of weakness, several markets are nearing areas where the next price reaction could be significant.
The central concern is how dependent the broader market has become on continued strength in AI investment and technology valuations. A sustained decline in that sector could affect spending expectations, market confidence, and the performance of major indexes. Gareth's approach remains grounded in technical analysis, identifying the price levels where buyers may step in, where selling pressure could accelerate, and where the market would need to show confirmation before a trading setup becomes more compelling.
CoreWeave Stock: AI Debt Concerns Put $51–$53 Support in Focus
CoreWeave (CRWV) has become an important stock to watch as investors reassess the financial demands of building AI infrastructure. The company represents a broader concern surrounding capital-intensive AI businesses, where substantial investment in computing capacity creates pressure to generate sufficient revenue and profitability over time. With CoreWeave trading below $59 during today's analysis, Gareth focused on the possibility of additional downside before the stock reaches a more attractive technical support area.
The shift in sentiment extends beyond the U.S. market. Gareth highlighted a South Korean IPO involving an AI infrastructure-related company that reportedly attracted substantial demand, with the offering described as 400% oversubscribed, yet declined approximately 32% when trading began. That type of reversal illustrates how quickly enthusiasm can change when investors become less willing to support elevated valuations. Heavy demand during an offering does not guarantee sustained buying once shares begin trading publicly.
For CoreWeave, Gareth identified a potential support zone between $53 and $51, where three technical factors converge. A descending trend line approaches the $53 area, while a gap fill and the 88.6% Fibonacci retracement sit near $51. The Fibonacci level is measured from the stock's major low to its all-time high, providing another reference point for a possible reaction if selling pressure continues.
The combination makes this area worth watching for a potential technical bounce. Multiple support factors can strengthen the case for a reaction, although they do not guarantee one or establish a specific win rate. Gareth's framework emphasizes waiting for price to reach the identified zone and then evaluating the strength of the response. If buyers fail to defend the area, the technical picture would require reassessment rather than assuming support must hold.
S&P 500 Technical Analysis: 7,450 Support and 8,000 Resistance
The S&P 500 remains at an important technical crossroads as weakness in AI-related companies creates additional pressure on the broader market. Despite a gain of approximately 0.5% in Monday's session, overnight futures weakness suggested that buyers were still facing resistance. The index's ability to hold its underlying technical structure will help determine whether the recent pullback remains contained or develops into a deeper correction.
On the downside, Gareth identified 7,450 as a major support reference if the index breaks below its nearer-term trend line. That level connects with longer-term market structure and areas where buyers have previously responded. A confirmed break of immediate support would increase the importance of 7,450 as the next area to evaluate, particularly if technology stocks continue to weaken and selling broadens into other sectors.
The upside framework centers on the 8,000 area, where a longer-term trend line and previous price rejections create a significant resistance zone. Gareth noted that repeated failures near this level suggest sellers could become more active if the market advances toward it again. A sustained move through resistance would strengthen the bullish case, while another rejection could reinforce the existing trading range.
The S&P 500's next move will depend partly on whether buyers can stabilize technology shares and prevent weakness from spreading. The technical levels provide a practical roadmap: a break of nearer-term support brings 7,450 into focus, while a renewed advance makes the 8,000 resistance area increasingly relevant.
Oil Above $100 and Treasury Yields: How Macro Risks Affect Stocks
Crude oil has added another complication to the market outlook, with prices moving back above $100 per barrel during today's analysis. Rising tensions involving Iran, U.S. military activity, and threats to shipping routes have increased concerns about potential energy supply disruptions. Higher oil prices can create additional inflation pressure, particularly when elevated energy costs begin affecting transportation, production, and consumer spending.
Gareth also discussed how geopolitical decisions can be influenced by political timing, including the U.S. election calendar. However, the market impact depends on the actual developments affecting supply, demand, and expectations. For traders, the immediate consideration is whether oil can sustain its advance above $100 and whether that strength begins influencing inflation expectations and interest rates.
Meanwhile, the 10-year Treasury yield was moving modestly lower despite oil's strength. That divergence deserves attention because rising energy prices can contribute to inflation concerns, while falling yields may reflect expectations for slower economic growth or increased demand for government bonds. The relationship is rarely driven by a single factor, making the combination of oil, yields, and equity performance useful when assessing changes in market sentiment.
AI Capital Spending and the Risk to Consumer Demand
One of Gareth's broader economic concerns involves the concentration of spending and wealth creation around the AI investment cycle. Significant capital expenditures by major technology companies have supported demand across semiconductors, data centers, electricity infrastructure, and related industries. At the same time, rising equity valuations have supported household wealth among consumers with substantial market exposure.
Gareth described this imbalance through an "80/20 economy" framework, highlighting the difference between households facing financial pressure and those benefiting from investment gains. The percentages are best understood as an illustration of economic divergence rather than a verified measurement of recession conditions across the population. The underlying concern is that a meaningful decline in AI investment and stock market wealth could weaken an important source of economic support.
If AI spending slows, the effects could extend beyond technology companies. Reduced capital expenditures may affect suppliers, employment expectations, and business investment, while declining equity wealth could weigh on discretionary spending among higher-income households. Such a development would increase economic downside risks, although the magnitude would depend on how broadly the slowdown spreads and whether other areas of the economy remain resilient.
That possibility also helps explain why Treasury yields may decline during periods of technology-sector weakness. Bond investors may begin anticipating slower growth and a more accommodative Federal Reserve response. Gareth's framework connects the AI trade, consumer demand, and interest rates as related indicators of how market weakness could develop.
GM Stock Earnings: $76.50 and $75 Become Downside Levels
Earnings season continues to demonstrate how heavily stock prices depend on expectations. General Motors (GM) provided an example after reporting results above analyst estimates and announcing a $20 billion share repurchase program, according to the earnings details discussed in today's show. Despite those developments, the stock faced selling pressure as investors evaluated guidance that remained within the previously expected range.
When a stock enters earnings with elevated expectations, a positive report may already be reflected in its valuation. The market can respond negatively if forward guidance fails to support additional optimism. Gareth used GM to illustrate how price action after earnings can provide insight into investor positioning and the willingness of buyers to support a stock.
From a technical perspective, GM was approaching a potential break of its daily trend line. Gareth identified $76.50 as an initial downside area if the breakdown confirms, followed by approximately $75, where several previous pivot lows create another support reference. Those levels offer traders defined areas to evaluate, although a move toward either would depend on continued selling and confirmation of the weaker chart structure.
Earnings Volatility and Trader Psychology: RTX and 3M
Gareth also reviewed earnings reactions in RTX (RTX) and 3M (MMM), emphasizing the importance of volatility when searching for technical trading opportunities. RTX had reported strong results and was trading near $196 in the premarket session, while 3M showed a comparatively muted reaction. Despite the earnings developments, Gareth did not identify a compelling trade level in either stock.
That decision reflects a consistent part of his trading approach. Sharp price movements can push stocks into established support or resistance levels as traders react emotionally to new information. Those conditions may create opportunities to evaluate a potential reversal, provided the chart offers a clear setup and the risk can be defined.
However, volatility alone does not create an edge. The location of the move, the surrounding technical structure, and the reaction at a meaningful price level all contribute to the assessment. Sometimes the most disciplined decision is to remain on the sidelines until the market provides a better setup.
Gold Price Analysis: $3,950 Support and $3,500 Downside Risk
Gold is approaching an important technical decision following several sessions of weakening price action. Gareth pointed to the metal's difficulty holding a previously established support line, with price initially closing near the level, then moving below it, and struggling to recover. That sequence suggests buyers have been losing control of the immediate trend.
If the breakdown receives confirmation, Gareth identified $3,950 as the first downside target. A failure to stabilize around that area could expose a deeper move toward approximately $3,500, based on the broader chart structure. These levels represent potential technical destinations rather than guaranteed outcomes, and a sustained recovery above the broken support area would require reassessing the bearish setup.
The price action is especially relevant given the broader macroeconomic environment. Gold can respond to interest rates, currency movements, inflation expectations, and demand for defensive assets. However, those influences do not prevent technical breakdowns when selling pressure becomes dominant. Gareth's analysis keeps the focus on the chart and the price levels that would confirm or weaken the downside case.
Silver Price Analysis: $50 Support and $60 Resistance
Silver has also experienced technical weakness, although Gareth noted that its recent price action appeared somewhat more resilient than gold's. Despite breaking below support, silver had avoided a more aggressive decline during the sessions discussed, suggesting buyers were still attempting to defend the market.
The immediate downside reference sits near $50, while $60 represents an important level for a potential bullish recovery. As long as silver remains below $60, the weaker technical structure continues to favor the downside. A sustained recovery above that threshold would improve the outlook and suggest that buyers were regaining control.
The divergence between gold and silver is worth following because the metals do not always respond identically to market conditions. Silver has both investment and industrial demand characteristics, which can influence its relative performance. For now, Gareth's levels provide a framework for determining whether the recent resilience develops into a recovery or gives way to renewed selling.
Natural Gas Technical Analysis: Five-Day Selloff Tests Range Support
Natural gas has experienced five consecutive sessions of selling pressure, bringing the commodity closer to the lower portion of its established trading range. Gareth emphasized the importance of viewing the recent decline within the larger chart structure rather than treating each move as the beginning of a new trend.
Since February, natural gas has largely traded within a defined consolidation range, with repeated advances encountering selling pressure near the upper boundary. The latest pullback is bringing price back toward the lower portion of that structure, where buyers have previously attempted to stabilize the market.
A successful defense of range support could create another opportunity for a rebound within the consolidation pattern. Conversely, a confirmed breakdown would suggest that the established range is losing its influence and that a larger directional move may be developing. The reaction at the lower boundary will help determine which scenario becomes more likely.
Bitcoin Price Analysis: $81,000 Support Could Open the Door to $75,000
Bitcoin is approaching one of the more important technical levels in Gareth's current market framework. The cryptocurrency has repeatedly tested support near $81,000, creating a pattern in which buyers have been required to defend the same area several times.
Gareth compared the repeated testing to striking a floor with a hammer. Each successful defense keeps support intact, but continued pressure can eventually absorb available buying interest. The concern increases when price repeatedly returns to support without producing a meaningful rebound, suggesting that demand may be weakening.
A confirmed break below $81,000 would bring approximately $75,000 into focus as the next major downside support area. The speed of any move would depend on market liquidity, selling pressure, and whether buyers emerge at intermediate levels. Conversely, a sustained rebound away from $81,000 would improve the immediate outlook and reduce the pressure on that support zone.
Bitcoin's behavior also provides another perspective on broader risk appetite. If weakness in technology stocks coincides with declining cryptocurrency prices, it may suggest that investors are becoming less willing to hold higher-volatility assets. Gareth's technical framework makes $81,000 the immediate decision point, with $75,000 becoming increasingly relevant if support fails.
Market Outlook for October 20: Key S&P 500, Gold and Bitcoin Levels
Several important technical structures are being tested simultaneously in today's market. AI-related stocks are facing increased scrutiny over capital spending and profitability, while the S&P 500 must contend with technology-sector weakness and broader economic concerns. Rising oil prices add another source of uncertainty, and the behavior of Treasury yields may provide clues about changing growth expectations.
Gareth's analysis identifies CoreWeave's $51–$53 support zone as a potential area for a technical reaction, while the S&P 500's broader framework remains defined by 7,450 support and resistance near 8,000. Gold faces downside levels at $3,950 and potentially $3,500, silver needs to recover $60 to improve its technical outlook, and Bitcoin's repeated tests of $81,000 place $75,000 in focus if support breaks.
The common thread is the importance of confirmation. A stock or index reaching support does not automatically make it a buying opportunity, just as a move below a trend line does not guarantee an extended decline. Price behavior at those levels helps determine whether the market is absorbing selling pressure or preparing for another move lower.
For traders following Gareth's approach, the next opportunity may come from allowing the market to reach a well-defined technical area and evaluating the reaction without being influenced by the surrounding headlines. With several assets approaching important levels, discipline and a clear understanding of risk remain central to the game plan.
Disclaimer: This article is provided for educational and informational purposes only and does not constitute financial advice or a recommendation to buy or sell any security or asset. Trading and investing involve substantial risk, including the potential loss of principal. Technical levels and market scenarios are not guarantees of future performance. Always conduct your own research and consider your financial circumstances and risk tolerance before making investment decisions.
Trading involves substantial risk. All content is for educational purposes only and should not be considered financial advice or recommendations to buy or sell any asset. Read full terms of service.