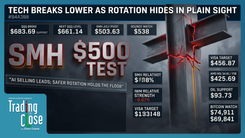
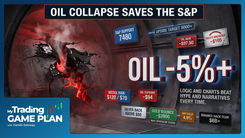
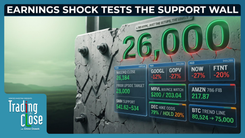
My Trading Game Plan Revealed - 11/03/2026: S&P 500 7470 Test, Oil Wedge Breakout Risk, High-Probability Earnings Setups

S&P 500 Nears Critical Support as Oil and Earnings Volatility Test Traders
The S&P 500 is approaching a major technical support level as geopolitical developments, midterm elections, and earnings volatility create a challenging environment for traders. With several markets approaching important chart levels, the coming sessions could help determine whether recent weakness develops into a deeper correction or creates opportunities for a recovery.
During the November 3 edition of My Trading Game Plan, Gareth Soloway, Chief Market Strategist at VerifiedInvesting.com, focused on the technical structures shaping his outlook. His analysis centered on the S&P 500's multi-year support, a developing wedge pattern in crude oil, and several individual stocks approaching potential reaction zones following earnings.
The central theme was patience. Sharp moves driven by headlines can create opportunities, but Gareth's approach requires price to reach meaningful technical levels before considering a trade. With volatility elevated across several asset classes, the location of those levels and the market's reaction to them become especially important.
S&P 500 Technical Analysis: Why 7470–7475 Is the Key Support Zone
The S&P 500 has weakened following its recent advance, breaking below an intermediate support level near 7570. While that breakdown reflects deteriorating short-term momentum, Gareth identified a more significant technical area just below current prices that could influence the market's broader direction.
The level to watch is 7470–7475, where a multi-year ascending trend line provides potential support. This trend line connects several important historical pivots and has previously influenced market direction. During an earlier test of the lower channel boundary, buyers stepped in and drove the index toward the upper resistance trend line, where the advance eventually stalled.
That history makes the approaching support test particularly relevant. A successful hold near 7470–7475 would preserve the larger technical structure and leave open the possibility of another advance toward the 8,000 area into year-end. The strength of any reaction, including whether buyers can reclaim broken resistance, would help determine how much conviction to place in that scenario.
A sustained break and daily close below the multi-year trend line would weaken the bullish setup and increase the risk of additional downside. Gareth's framework places particular emphasis on how price behaves at support, rather than assuming that a historically important level will automatically produce another rally.
The broader political backdrop adds another variable. With U.S. midterm elections underway, traders are evaluating how the election outcome could influence fiscal policy, regulation, and market expectations. Divided government has sometimes been viewed favorably by equity markets because it can limit major policy changes. However, the country's fiscal challenges complicate that interpretation, particularly if political gridlock makes longer-term budget decisions more difficult.
For now, the S&P 500 chart provides a clearer near-term reference point. The 7470–7475 zone is the level that could determine whether the current pullback remains part of the broader uptrend or develops into a more meaningful technical breakdown.
Crude Oil Price Outlook: A Long-Term Wedge Points to Major Support and Resistance
Crude oil has experienced substantial volatility as geopolitical headlines continue to influence short-term price action. Reports involving Iran, Qatar, and diplomatic developments have contributed to rapid moves in both directions, illustrating how quickly sentiment can change in the energy market.
During the period discussed in Gareth's analysis, oil experienced a sharp decline following reports of a potential diplomatic agreement involving Qatar. Prices then rebounded toward \$99 a barrel amid reports of U.S. military action involving Iran before reversing again as additional diplomatic developments emerged.
These moves created significant intraday volatility, but Gareth's attention remained on a longer-term chart formation. Oil has been trading within a large wedge pattern, with price action gradually compressing between converging support and resistance trend lines. The recent decline brought crude back toward the lower boundary of that formation.
The importance of this pattern comes from the narrowing trading range. As the distance between support and resistance decreases, the market approaches a point where a directional resolution becomes increasingly likely. However, the pattern alone does not establish which direction the eventual move will take.
A confirmed daily close below wedge support would weaken the technical structure and bring the \$70 area into focus as a potential longer-term downside objective. Conversely, a sustained breakout above the upper boundary could open a path toward higher resistance, with the \$120 area representing a potential upside objective in Gareth's broader analysis.
Both outcomes remain conditional on confirmation. A temporary move beyond either trend line, particularly during a headline-driven session, could reverse before the daily close. Waiting for a confirmed break helps distinguish a developing directional move from another short-lived reaction to geopolitical news.
The immediate focus is the lower wedge boundary and whether buyers can defend it. Until the pattern resolves, the chart supports patience rather than an aggressive directional assumption.
Apple Stock Analysis: The \$300 Level and Technology Sector Rotation
Technology stocks have experienced uneven performance as capital moves between artificial intelligence-related companies and more established large-cap names. Apple's recent price action provides an example of how those rotations can influence individual stocks even when the underlying earnings results appear constructive.
Apple reported results that exceeded revenue and earnings expectations in the period discussed, but concerns about rising memory costs and their potential effect on margins contributed to weakness in the stock. Shares were trading near \$325 in Gareth's morning analysis, following a period in which Apple had benefited from relative strength compared with portions of the AI sector.
From a technical perspective, Apple remains within a long-term ascending parallel channel. The upper boundary has repeatedly acted as resistance, while the lower boundary has attracted buyers during previous pullbacks. This structure gives traders a defined framework for evaluating potential entries and the risk associated with buying at different points inside the channel.
At approximately \$325, Apple was positioned between the two boundaries, offering less favorable technical positioning for a new swing trade. Gareth instead identified the \$300 area as a more compelling potential support zone because it aligns with the lower boundary of the ascending channel and a widely followed psychological price level.
A decline toward \$300 would represent a meaningful pullback, but the technical appeal comes from the combination of channel support and a clearly identifiable area for evaluating price reaction. Traders would still need to assess whether buyers are defending that zone and whether the broader market environment supports a recovery.
If Apple reaches the lower channel boundary and stabilizes, the setup could offer a more favorable risk-to-reward profile than an entry near the middle of the channel. A sustained breakdown below that boundary would weaken the existing structure and require a reassessment of the bullish thesis.
Palantir Stock: Earnings Weakness Puts \$156 and $120–$125 in Focus
Palantir's earnings report highlighted continued business momentum, including stronger revenue and profit results alongside constructive forward guidance. The company also showed progress in expanding its commercial business and diversifying its revenue sources, developments that may support its longer-term growth outlook.
Despite those positives, the stock came under pressure, falling approximately \$12 from its previous close and trading near \$166 during the morning analysis. The reaction illustrates how valuation expectations can influence price even when a company delivers favorable operating results.
Gareth identified two separate technical areas for traders with different time horizons. The first is an unfilled gap near \$156, which could become a short-term reaction zone if selling continues. Gap fills can attract trading activity because they represent areas where price previously moved quickly, leaving relatively little trading history within the range.
For a potential swing trade, Gareth's preferred area sits considerably lower, between \$120 and \$125. This zone combines an unfilled gap near \$125 with an ascending trend line approaching \$120. The alignment of two independent technical factors makes the area more significant than either level would be on its own.
That confluence provides a location to evaluate a potential entry, but it does not guarantee support. The strength of the selling pressure, broader market conditions, and price behavior upon reaching the zone would all influence whether the setup remains attractive.
The practical takeaway is that Palantir's earnings decline does not automatically create a favorable entry. Gareth's framework separates a potential short-term reaction near \$156 from the deeper technical structure around $120–$125, where a swing setup could become more compelling if price eventually reaches that area.
Shopify Stock: \$123 Support and a Deeper Swing Trade Level Near \$106
Shopify also experienced significant earnings-related selling, with shares declining from approximately \$156 to the \$130 area in the morning session described. That type of move can attract traders looking for an immediate rebound, although the initial decline may continue as the market adjusts to new expectations.
Gareth identified a nearby technical area around \$123, where a previous pivot low aligns with a gap on the chart. This creates a potential short-term reaction zone approximately \$7 below the price discussed during the broadcast.
The \$123 level is relevant because it combines prior price structure with an area where the stock previously moved through a range quickly. If Shopify continues lower, traders can evaluate whether buying interest emerges as price approaches that zone. A failure to hold would leave the stock vulnerable to further weakness.
For a longer-term swing setup, Gareth highlighted a more substantial ascending trend line near \$106. That level connects important historical lows and represents a deeper area of potential support within the stock's broader technical structure.
The separation between these levels is important. A short-term reaction near \$123 could occur without establishing a durable bottom, while the \$106 trend line offers a different setup for traders willing to wait for a larger pullback.
Gareth's approach favors identifying these areas in advance and allowing the market to determine whether they become actionable. The presence of support creates a reason to watch price behavior, while confirmation and risk management remain necessary before considering a position.
Intel Earnings Sell-Off: Why Waiting for Technical Support Matters
Intel provided one of the clearest examples of Gareth's preference for patience following a major earnings-driven decline. After a sharp sell-off, the stock continued to experience volatility as traders reassessed its outlook and the market worked through the initial selling pressure.
A substantial earnings gap can produce several rounds of selling. Investors may reduce exposure, short-term traders may exit losing positions, and leveraged accounts can face additional pressure. These dynamics help explain why an immediate attempt to buy a sharp decline can carry considerable risk.
Rather than entering during the initial reaction, Gareth tracked a longer-term ascending trend line connecting a significant low near \$19 from August 2025 with a subsequent pivot. That trend line had remained untested until Intel's recent decline brought shares back toward the area.
Intel moved below \$60 during the prior session before rebounding, with shares trading around \$62.40 during the morning analysis. The recovery demonstrated how a well-established technical level can attract buying interest after an extended decline.
The timing was central to the setup. Waiting for the stock to reach the trend line provided a defined area for evaluating the reaction and managing downside risk. Although the rebound was meaningful, the trade still carried the possibility that support could fail or that selling pressure could return.
Gareth also identified a lower gap-fill area between \$52 and \$53 as a potential downside reference if Intel weakens again. That level provides an additional point on the chart for evaluating the stock should the recovery lose momentum.
The Intel example reinforces a consistent element of Gareth's methodology: a sharp decline can create interest, but a technically justified entry requires more than the size of the sell-off. Waiting for support, evaluating the reaction, and defining risk remain essential parts of the process.
Gold, Silver and Bitcoin: Technical Levels Across Commodities and Crypto
Outside equities, Gareth reviewed several important levels in precious metals and cryptocurrency markets. Gold, silver, and Bitcoin each face different technical conditions, but all three demonstrate the value of separating short-term price movement from the larger chart structure.
Gold recently tested a pivot low near \$3,885 before staging a modest recovery. That level provides a reference for evaluating whether buyers are beginning to defend the recent decline. While Gareth discussed the potential appeal of accumulating physical gold at lower prices, the chart had yet to establish a stronger confirmation signal for an aggressive short-term trading position.
Silver briefly declined toward \$48.60 before recovering toward \$50. Gareth's broader assessment remained neutral to bullish, with pullbacks potentially offering opportunities to evaluate longer-term exposure. The recovery from the recent low was constructive, although additional price stability would strengthen the case for a sustained advance.
Bitcoin remains closely tied to shifts in broader market risk appetite. Despite a temporary recovery during the recent moves in oil and other assets, its technical structure continued to show weakness, with price approaching an important support area around \$75,500.
Gareth identified the psychological \$75,000 level as another potential area where a deeper decline could attract buying interest. A test of that zone might help establish a more durable base if selling pressure begins to ease, but a sustained breakdown would increase downside risk.
For Bitcoin, the next important development is whether buyers can defend the $75,500–$75,000 region and produce a meaningful recovery. Until the chart shows stronger evidence of stabilization, the support zone remains an area to evaluate rather than a confirmed bottom.
Trading Outlook: Key S&P 500, Oil and Earnings Levels to Watch
The November 3 market setup brings several important technical decisions into focus. The S&P 500 is approaching multi-year support at 7470–7475, crude oil is testing the lower boundary of a long-term wedge, and individual stocks are moving toward defined reaction zones following earnings volatility.
These setups share a common principle in Gareth Soloway's analysis: the quality of a potential trade depends on the technical location, the factors supporting that level, and the market's response when price arrives.
For the broader market, a successful defense of S&P 500 support would preserve the possibility of another advance toward 8,000. A confirmed breakdown would weaken that outlook. In oil, a daily close beyond the wedge boundaries could provide the directional signal that has been missing during the recent headline-driven swings.
Among individual stocks, Apple's \$300 channel support, Palantir's $120–$125 confluence zone, and Shopify's deeper trend line near \$106 represent areas where Gareth sees more favorable potential swing trade structures. Intel's recent rebound offers a practical example of why allowing price to reach support can improve the clarity of a trading decision.
The bottom line: With volatility elevated, Gareth's game plan remains focused on defined levels, technical confluence, and confirmation. The market may reach several important decision points in the coming sessions, but the stronger opportunities will depend on how price behaves when those levels are tested.
This article is for educational and informational purposes only and does not constitute financial advice or a recommendation to buy or sell any security or asset. Technical levels and scenarios are subject to change, and all trading involves risk.
Trading involves substantial risk. All content is for educational purposes only and should not be considered financial advice or recommendations to buy or sell any asset. Read full terms of service.