My Trading Game Plan Revealed - 11/10/2026: CPI Shock Shakes Markets Fed Hike Odds Rise and Confirmation Signal for Traders

Hot CPI Sends Stocks Lower as Gareth Soloway Watches Key Support Levels
Game Plan Revealed | November 10, 2026
October's hotter-than-expected inflation report put renewed pressure on stocks, gold, and Bitcoin Tuesday morning, raising fresh questions about how aggressively the Federal Reserve may need to respond. For Gareth Soloway, Chief Market Strategist at Verified Investing, the immediate selloff brought an important technical question into focus: Will the market confirm a breakdown below support, or will buyers once again step in before the bearish setup is complete?
During Tuesday's My Trading Game Plan, Gareth examined the inflation data, the reaction in Treasury yields and the U.S. dollar, and the technical structures developing across major asset classes. His central message was one of patience. Markets can move sharply on economic news, but the strongest trading opportunities often develop after the initial reaction, when price action begins to establish whether a move has staying power.
October CPI Comes in Hot as Fed Rate Hike Expectations Rise
The October Consumer Price Index increased 0.4% month over month, above the 0.3% economists had expected. Core CPI, which excludes food and energy, rose 0.3%, also coming in slightly hotter than anticipated. Although headline inflation slowed from September's 0.6% monthly increase, the latest report showed that underlying price pressures remain persistent.
The composition of the report added to the concern. Shelter costs rose 0.3%, accounting for more than 30% of the overall monthly increase, while food prices advanced 0.5%. Energy prices increased 0.7%, considerably slower than September's 5.2% surge. The figures suggest inflationary pressure continues to extend beyond the most volatile components of the index, complicating the Federal Reserve's effort to bring inflation back toward its 2% target.
The market response was immediate. In Gareth's morning analysis, S&P 500 futures had fallen approximately 80 points, while Nasdaq futures dropped from around 28,000 toward 27,590 before recovering to approximately 27,720. The move reflected growing concern that persistent inflation could keep interest rates elevated and force investors to reconsider valuations across risk assets.
Federal Reserve Policy and Rising Treasury Yields
Federal Reserve Governor Christopher Waller added to the pressure by discussing the possibility of a 50-basis-point rate increase at the December meeting if inflation remained sufficiently elevated. Waller indicated that he was leaning toward a 25-basis-point increase under his baseline outlook, while acknowledging that a larger move could be appropriate if the data justified it.
That leaves the Fed facing a difficult decision. Inflation remains above target, but the central bank must also consider the effects of additional tightening on economic growth and employment. A December increase is widely anticipated, although the size of that move and the path of rates into 2027 remain uncertain.
Gareth connected this changing policy outlook to the pressure developing across financial markets. Rising Treasury yields increase competition for investment capital, while a stronger dollar can weigh on commodities and other dollar-denominated assets. Higher borrowing costs also create additional challenges for companies whose valuations depend heavily on future earnings growth. Together, these forces help explain why equities, precious metals, and cryptocurrencies can weaken simultaneously following an inflation surprise.
S&P 500 Technical Analysis: Why Breakdown Confirmation Matters
One of Gareth's most important lessons from Tuesday's show centered on the difference between an initial trendline break and a confirmed technical breakdown. The distinction becomes particularly useful during volatile sessions, when traders can be tempted to react immediately to sharp moves through established support or resistance.
Gareth pointed to last week's S&P 500 price action as an example. During Thursday's selloff, the index broke below an important trendline, creating what initially appeared to be a bearish technical signal. However, the subsequent session failed to produce the additional price confirmation required under his trading methodology. That failure helped preserve the possibility of a reversal, which subsequently developed as buyers returned.
How Gareth Soloway Uses the Confirmation Signal
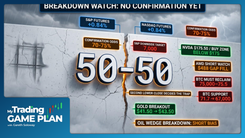
Under Gareth's confirmation framework, an initial close below a trendline establishes a potential breakdown. The next step is to look for a subsequent candle to close below the low of that initial breakdown candle. When that occurs, the bearish signal gains additional credibility because sellers have demonstrated an ability to extend the move beyond the first break.
A failure to confirm leaves open the possibility that the initial move was a false breakdown. This is particularly important around widely watched technical levels, where stop-loss orders and short-selling activity can contribute to sharp price movements. A market can temporarily move below support, trigger selling, and then recover as buyers regain control.
Gareth has described confirmed breakdowns as having substantially better probabilities than unconfirmed breaks, citing approximately 75% in his discussion. That figure should be understood as part of his trading framework rather than a universally established statistical outcome. Market conditions, time frames, and the specific technical setup can all influence the reliability of a signal.
The S&P 500's ability to recover its major trendline following last week's decline demonstrated why Gareth emphasizes waiting for confirmation. With Tuesday's CPI report creating renewed selling pressure, the same framework becomes relevant again. A sustained move below support, followed by confirmation, would strengthen the bearish technical case. Another failed breakdown would suggest buyers are still defending the broader structure.
Stock Market Trading Setups: Sandisk, ONON, Microsoft, and Tesla
The broader market weakness also brought several individual stocks into focus. Gareth's approach remained consistent across these setups: identify meaningful technical levels in advance, evaluate the conditions when price reaches them, and avoid chasing moves simply because a stock has already fallen sharply.
Sandisk Stock: Watching the $735 to $775 Support Zone
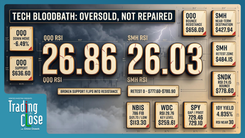
Sandisk provided a recent example of how technical support and oversold conditions can combine to create a swing trading opportunity. According to Gareth's analysis, the stock reached an important support area last Friday while showing deeply oversold characteristics. Buyers subsequently stepped in, producing a strong rebound that offered an opportunity to take profits into strength.
Following that move, Gareth shifted his attention back toward lower support. The technical zone identified in the original analysis extends from approximately $735 to $775. A pullback toward that area would bring Sandisk back into a region where Gareth would reassess the potential for another swing setup.
The important consideration is how price behaves when it reaches support. An oversold reading can strengthen a setup, but it does not guarantee that selling has finished. Gareth's approach combines the location of price on the chart with supporting technical evidence before evaluating whether the potential reward justifies the risk.
ONON Earnings and Mega-Cap Technology Stocks
ONON also attracted attention following earnings-related weakness. Gareth identified a lower technical reference level in the original discussion, emphasizing that patience may offer a more favorable setup than entering immediately after the initial decline. The specific price reference requires confirmation against the chart before publication, but the trading principle remains clear: a predefined entry area helps prevent an emotional reaction to earnings volatility.
Among mega-cap technology stocks, Microsoft demonstrated relative resilience during the early market weakness, while Tesla pulled back following a substantial two-day rebound. These differences in performance can provide useful information about underlying market strength. Stocks holding up better than the broader indexes may warrant additional attention, while names giving back recent gains can reveal where momentum is beginning to weaken.
Oil Prices, Inflation, and the Delayed Impact of Energy Costs
A particularly important macroeconomic question from Tuesday's discussion involved the relationship between falling oil prices and persistent inflation. Crude oil had moved lower, yet the October CPI report still showed price pressures running above expectations. Gareth suggested that the explanation may involve the delayed effects of earlier increases in energy and transportation costs.
Businesses do not always pass higher input costs directly to consumers when those expenses first appear. Some absorb the increases temporarily, reducing profit margins while waiting to see whether conditions improve. When elevated costs persist, companies may eventually raise prices to protect profitability, creating a delayed impact on consumer inflation.
Gareth connected this possibility to the prolonged disruption surrounding Iran and energy markets. Higher diesel, shipping, and production expenses can work their way through supply chains over time. Even if crude oil begins to retreat, prices already passed along to consumers may remain elevated, particularly when companies are still recovering earlier cost increases.
This creates a potential lag between movements in energy markets and the inflation data. The October CPI report also showed that shelter and food contributed meaningfully to monthly inflation, indicating that energy alone cannot explain the broader picture. For traders, the implication is that a sustained decline in oil prices may help ease future inflation pressure, but the effects could take time to appear in the data.
Natural Gas Technical Analysis: The 315 Resistance Level
Natural gas offered another example of Gareth's confirmation methodology. In his chart discussion, he identified the 315 area as an important technical reference, although the exact instrument and quotation convention should be verified against the broadcast.
Gareth described a previous move above that level that initially appeared bullish but failed to generate the necessary follow-through. Without a secondary confirming close, the breakout remained vulnerable, and prices subsequently reversed. As natural gas approaches the area again, the technical question is whether buyers can establish a more convincing move through resistance.
The example reinforces a broader principle across markets. A break through an established level can attract attention, but sustained follow-through provides stronger evidence that the balance between buyers and sellers has changed.
Gold Price Analysis: $3,875 Support and the $3,500 Downside Target
Gold came under renewed pressure as the inflation report strengthened expectations for tighter monetary policy. The combination of higher Treasury yields and a firmer U.S. dollar created a more challenging environment for the precious metal following its recent rebound.
Gareth identified approximately $3,875 as an important technical support area, corresponding to a previous low on the chart. That level represents a meaningful reference point for evaluating whether the recent recovery can maintain its structure or whether sellers are beginning to regain control.
A confirmed breakdown below $3,875 would strengthen the bearish technical case and bring the $3,500 area into consideration as a potential downside target. However, the confirmation process remains important. A temporary move below support followed by a recovery would provide a different signal than a sustained break with additional selling.
The larger macro backdrop also matters. Gold can benefit from uncertainty and concerns about inflation, but rising real yields and a stronger dollar can create competing pressures. Gareth's technical levels provide a framework for evaluating which influence is gaining control of price action.
Silver Price Analysis: Long-Term Support Near $45
Silver experienced a sharper decline during Tuesday's session, falling approximately 3% in the original market discussion. Gareth approached the metal from a longer-term perspective, focusing on a historical chart structure connected to major price areas established around 1980 and 2011.
The lower boundary of the support region discussed by Gareth sits near $45 per ounce. This area becomes particularly relevant if selling continues, as it represents a longer-term technical reference rather than a short-term trading level.
For investors using a gradual accumulation strategy, Gareth discussed building exposure below $50 and considering additional purchases at successive $5 declines. Such an approach spreads entries across multiple price levels rather than committing an entire position at once. It also carries the risk of increasing exposure during a prolonged downtrend, making position sizing and overall portfolio risk important considerations.
Bitcoin Price Analysis: $75,500 Rejection Puts $72,000 and $67,000 in Focus
Bitcoin remained under pressure following its recent breakdown below the $75,500 area. Gareth identified that level as an important technical reference because the cryptocurrency had previously lost support there and subsequently attempted to reclaim it.
The recovery attempt brought Bitcoin back toward $75,500, but Tuesday's inflation report coincided with renewed selling. The rejection reinforced the importance of the former support area, which now represents potential resistance until buyers can establish a sustained recovery above it.
Bitcoin Support Levels to Watch Next
Gareth's next major downside reference sits just below $72,000, based on a trendline connecting recent low pivots. This area could attract buyers if Bitcoin continues to decline, although the strength of any reaction would need to be evaluated as price approaches the level.
If that support fails, Gareth identified approximately $67,000 as a deeper technical target. The distance between these areas highlights the importance of recognizing when a major support level has been lost. Traders entering without a clear understanding of the next potential downside reference can underestimate the room available for further selling.
Bitcoin's response to the CPI report also illustrates its sensitivity to broader liquidity conditions and risk appetite. When interest-rate expectations shift higher, speculative assets can face additional pressure as investors reassess risk exposure. Gareth's chart framework provides specific levels for tracking that pressure without assuming that every decline must continue indefinitely.
What Traders Should Watch After the CPI Report
The next important economic release is the October Producer Price Index, scheduled for Friday, November 13. PPI measures price changes received by domestic producers and can provide additional information about inflation pressures moving through the production and supply chain system.
For Gareth's broader market framework, the combination of incoming inflation data, Treasury yields, the dollar, and technical price confirmation will remain important. Additional evidence of persistent inflation could reinforce expectations for tighter Federal Reserve policy, while signs of easing price pressures may reduce some of the pressure on risk assets.
The technical levels identified during Tuesday's show provide a practical roadmap. The S&P 500's behavior around its major trendline will help determine whether sellers are establishing a more durable breakdown. Gold's $3,875 support, Bitcoin's $75,500 resistance and lower support levels, and the longer-term structure in silver offer additional reference points for assessing the direction of market sentiment.
The Bottom Line: Let Price Confirmation Guide the Trading Plan
Tuesday's CPI report reinforced the challenge facing financial markets as inflation remains elevated and expectations for Federal Reserve policy continue to shift. Higher yields and a stronger dollar have added pressure across multiple asset classes, but the initial reaction to economic data does not establish how far a move will ultimately extend.
Gareth's approach centers on identifying important technical levels, evaluating the evidence around them, and waiting for price confirmation before assigning greater conviction to a breakout or breakdown. Last week's failed S&P 500 breakdown demonstrated the value of that discipline, and Tuesday's renewed volatility has brought the same lesson back into focus.
For traders, the framework is straightforward: know the levels, understand the macro pressures behind the move, and let the chart establish whether buyers or sellers have gained control. A strong reaction to the news can create opportunity, but confirmation and risk management remain essential to evaluating the trade.
This article summarizes market analysis and technical levels discussed by Gareth Soloway on My Trading Game Plan on November 10, 2026. It is provided for educational and informational purposes only and does not constitute personalized financial advice. Technical levels, scenarios, and historical trading observations are not guarantees of future results. Trading and investing involve risk, including possible loss of principal.
Trading involves substantial risk. All content is for educational purposes only and should not be considered financial advice or recommendations to buy or sell any asset. Read full terms of service.