Trading The Close Market Recap - 11/09/2026: S&P Bounce, NVIDIA vs AMD Rotation and Metals Rally

Stock Market Rally Tests Key Resistance as S&P 500, QQQ and Semiconductors Rebound
Monday's market rally delivered a sharp reversal from last week's selling, but the more important development was what happened at the charts. Several major indices and semiconductor names recovered from technical breakdowns that had yet to establish meaningful downside follow-through. For traders watching the close, the question now is whether buyers can defend those reclaimed levels as the market approaches overhead resistance.
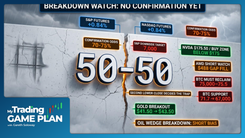
On the November 9 edition of Trading the Close, Verified Investing Pro Trader Drew Dosek examined the rebound across the S&P 500, Nasdaq-100 ETF (QQQ), and semiconductor sector. His central lesson was straightforward: one candle through support does not necessarily establish a new trend. Monday's price action reinforced the value of waiting for confirmation, particularly when markets are stretched and sentiment has turned sharply negative.
The recovery also revealed important differences beneath the surface. Semiconductor stocks participated in the rebound, but NVIDIA and AMD followed very different paths. Gold and silver continued to work through their own resistance levels, while Bitcoin remained under pressure. Together, these charts provided a useful framework for separating an oversold bounce from a more durable recovery.
S&P 500 and QQQ Rally After Failed Technical Breakdowns
The S&P 500 entered Monday following a difficult stretch that pushed price action below an important rising trendline. Thursday's large red candle raised concerns that the broader market was beginning a more sustained correction. However, the breakdown had produced only limited confirmation before buyers returned.
Drew emphasized why that sequence matters. A trendline break can be an early warning, but traders still need to evaluate the closing price, subsequent candles, and whether sellers can sustain momentum below support. When price quickly recovers a broken level, the original bearish signal becomes less convincing.
Monday's rebound brought the S&P 500 back into its longer-term rising parallel channel, improving the immediate technical picture. The next challenge is overhead resistance. Drew's chart identified 760.40 as an important prior pivot and 765.97 as the upper portion of Thursday's selling range. Those areas provide reference points for evaluating whether the recovery can extend or begins to stall.
The Nasdaq-100 ETF, QQQ, displayed a similar structure. Last week's decline brought the ETF toward a rising trendline extending from the April 2025 lows, leaving the market technically stretched. Monday's recovery demonstrated that buyers were still willing to defend that longer-term structure, even after the sharp deterioration in sentiment.
For QQQ, Drew identified $655.27 as an important downside reference, with the $700 region representing potential overhead resistance associated with previous price pivots. The size of Monday's advance is encouraging for bulls, but a sustained move through resistance would provide stronger evidence that the recovery has room to continue. A return below reclaimed support would put the bearish scenario back into focus.
Semiconductor Stocks Rebound as NVIDIA and AMD Diverge
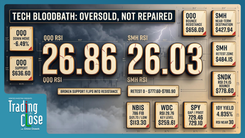
Semiconductors provided one of Monday's clearest examples of how oversold conditions can produce aggressive countertrend moves. The VanEck Semiconductor ETF (SMH) advanced approximately 5.05%, recovering after its daily Relative Strength Index had fallen below 30.
That oversold reading suggested selling had become extended, although RSI alone cannot establish a bottom. The more useful development was the combination of an extreme momentum reading and a breakdown that failed to generate sustained follow-through. SMH now faces a technical test near $492, where Drew identified resistance associated with the session's high and a declining trendline.
The sector's recovery was particularly interesting because its largest names did not respond uniformly. NVIDIA remained affected by negative headlines and company-specific uncertainty, while AMD posted a much stronger advance. That divergence matters because a broad semiconductor rebound does not necessarily mean every stock within the group offers the same technical opportunity.
NVIDIA Tests Major Support as RSI Reaches Oversold Territory
NVIDIA's recent decline brought the stock into a technically important area associated with a January 2025 pivot. That region previously marked a significant transition in the stock's price structure before an extended period of consolidation.
With the daily RSI near 27.4, NVIDIA was deeply oversold according to Drew's chart. The stock also recovered more than $8 from its intraday low, suggesting buyers were beginning to respond near support. Neither development confirms that the correction has ended, but together they make the reaction around this area worth watching.
Drew identified $190 as a potential recovery level, with $223 representing a more distant upside reference if the stock can establish a sustained reversal. The immediate question is whether buyers can build on the bounce without allowing another breakdown through the recent support zone.
AMD Surges as Traders Watch the Next Resistance Zone
AMD moved sharply in the opposite direction, gaining approximately 13.26% and reclaiming a declining trendline. That recovery was a constructive technical development following the stock's earlier weakness.
The size of the move also creates a different challenge for traders. After a double-digit advance in one session, AMD is approaching areas where prior price action may attract selling. Drew's chart highlighted a rising trendline as the next resistance reference, followed by an overhead gap region.
A period of consolidation would give traders more information about whether buyers can maintain control. The larger lesson from the NVIDIA and AMD divergence is that sector strength should be evaluated alongside each stock's individual chart. Two companies can participate in the same industry trend while presenting very different risk and reward profiles.
Gold and Silver Approach Resistance as Treasury Yields Stabilize
Outside equities, Treasury yields and precious metals remained important parts of the broader technical picture. The 10-year Treasury yield moved modestly higher Monday after declining through much of the previous week, leaving it within a parallel channel that Drew continues to monitor.
His chart identified 4.91% as an intermediate resistance reference and 4.965% as a more substantial overhead level. A sustained move through those areas would suggest renewed upward pressure on yields, while continued rejection would keep the recent cooling trend in place.
Gold, meanwhile, rebounded from a significant historical support region associated with price pivots from October 2025 and the middle of 2026. The metal is now testing resistance near $4,104.14, an area Drew has emphasized in previous analysis.
A level with that degree of technical history can require multiple attempts before price establishes a sustained breakout. Consolidation below resistance would allow traders to evaluate whether buyers are absorbing available supply. If gold eventually clears the area with confirmation, Drew's next major upside reference sits near $4,300.
Silver showed stronger relative momentum, gaining approximately 2.62% and pressing toward the upper boundary of its consolidation pattern. Drew identified $59.34 as an upside reference associated with a parallel-channel midpoint and previous resistance.
The longer-term silver chart remains constructive within a rising channel extending back to 2008. Its recent move through a major historical pivot from 2011 adds to the bullish technical case, although the immediate resistance test still matters. Silver has the stronger momentum profile of the two metals, while gold is working through a more clearly defined overhead barrier.
Bitcoin Breaks Support as Traders Monitor the $68,638 Level
Bitcoin presented a different technical picture from the recovering equity market. After losing support near $80,500, the cryptocurrency declined toward $75,000, leaving its recent breakdown unresolved.
Drew's next important downside reference sits near $68,638, a level associated with the lower boundary of a previous parallel channel that supported price between June and August. That historical reaction gives the area technical relevance, but it does not guarantee buyers will defend it again.
For traders evaluating Bitcoin, the priority is to watch how price behaves as it approaches established support. A slowing decline, stabilization, and subsequent recovery would offer more evidence of demand than the level alone. Continued selling through the area would weaken the case for a near-term bottom.
The contrast with equities is worth recognizing. While the S&P 500 and QQQ were reclaiming portions of their recent breakdowns, Bitcoin had not demonstrated the same degree of technical recovery. That divergence argues for treating each market on its own structure rather than assuming a broad risk-asset rebound will lift every asset equally.
Oil and Natural Gas Show Opposing Technical Setups
Energy markets also offered contrasting signals. Crude oil declined during Monday's session, with Drew highlighting $86.90 as an important support area that had held during the previous week's trading.
That level remains a reference for assessing whether sellers can extend the decline. A sustained daily close below support would weaken the existing structure, while another successful defense could keep oil within its recent trading range. Geopolitical developments, particularly those affecting supply routes through the Strait of Hormuz, remain a potential source of volatility.
Natural gas has followed a much stronger path since its October 30 low, advancing through multiple resistance levels and gaining approximately 6% during Monday's session. The move has improved the commodity's technical structure, but it has also brought price closer to a previous pivot high from March 2026.
With RSI approaching 70, natural gas is becoming extended on the upside. Drew's framework favors watching for a controlled pullback toward the recently broken declining trendline rather than assuming the current momentum can continue without interruption. A successful retest would provide additional evidence that former resistance is beginning to function as support.
Lunar and Honeywell Test Resistance After Aerospace Developments
Individual stock catalysts created additional opportunities to evaluate how price responds to news. In the aerospace sector, Lunar (LUNR) attracted attention amid developments surrounding government space programs and potential contract activity.
The stock remains well below its previous pivot high near $46.75, leaving substantial overhead price history to work through. Drew identified $14 as an initial upside reference and $17.33 as a more significant resistance level associated with a Fibonacci retracement.
The immediate issue is confirmation. A strong reaction to news can bring a stock back into focus, but follow-through in the next session helps determine whether buyers are establishing a more durable move. For Lunar, the reaction around the initial resistance level will be important in evaluating the strength of the setup.
Honeywell (HON) also advanced, gaining approximately 4.07% and returning to resistance near $230.46. That level had previously rejected price, making Monday's retest an important technical development.
Repeated tests can indicate persistent buying interest, although resistance remains intact until price demonstrates otherwise. If Honeywell consolidates and eventually clears the area, Drew's chart points toward resistance around $240 to $241, with a declining trendline near $244.60 providing another reference.
Take-Two Interactive: Fibonacci Support and the Risk of Chasing Momentum
Take-Two Interactive (TTWO) provided another example of why entry location matters, particularly when a stock is attracting attention around earnings and major product developments.
Following its earnings reaction, Take-Two declined toward $197.50 before recovering to approximately $221. Drew highlighted an earlier pullback to the 61.8% Fibonacci retracement near $185.48, where the stock had previously found support.
That reaction illustrates how a well-established technical level can help traders identify an area where the balance between risk and potential reward may be more favorable. The subsequent advance, however, changes the calculation for anyone considering a new position.
With the stock trading substantially above its earlier support area, Drew identified a rising trendline near $213 as a possible reference on a pullback. The key is whether price can return toward support in an orderly fashion and demonstrate renewed buying interest.
Major product expectations may influence sentiment, but the chart remains the primary tool for evaluating an entry. A stock can have a compelling fundamental story while offering a less attractive technical setup after a rapid advance.
Drew Dosek's Trading Lesson: Confirmation Before Conviction
The most useful lesson from Monday's session was the importance of distinguishing an initial technical signal from a confirmed change in trend.
Last week's selling created apparent breakdowns across several major charts. Monday's rebound challenged those signals and demonstrated how quickly price can reverse when markets become extended. Traders who treated the first break as conclusive had little opportunity to account for that reversal.
Drew's approach centers on building a probability-based framework before entering a trade. Support and resistance establish the areas worth watching. Momentum indicators provide context about whether a move is extended. Subsequent price action helps determine whether the original thesis is gaining or losing credibility.
The same principles apply to both sides of the market. An RSI reading below 30 can identify an oversold condition, but price can remain oversold during a persistent decline. A Fibonacci retracement can highlight a potential reaction area, but the level becomes more useful when supported by additional technical evidence.
This approach also discourages chasing moves after they have already extended. Whether evaluating AMD after a double-digit rally, natural gas near overbought territory, or Take-Two well above its earlier support, the quality of the entry remains an important part of the trading decision.
Stock Market Outlook: Key Levels to Watch After Monday's Rally
Monday's recovery improved the immediate technical outlook for several major equity benchmarks, but the next session will help determine how much progress buyers have actually made.
The S&P 500 and QQQ need to defend their reclaimed technical structures while working toward overhead resistance. Semiconductor strength remains constructive, although the difference between NVIDIA and AMD shows why traders should avoid treating the sector as a single uniform trade. Gold and silver are approaching important resistance levels, while Bitcoin continues to search for evidence that its recent decline is stabilizing.
The broader market also remains sensitive to upcoming economic releases and company-specific developments. Those catalysts can accelerate moves through technical levels, making closing-price confirmation and risk management particularly important.
For Drew, the framework coming out of Monday's session is clear: the rebound deserves attention because it challenged several bearish breakdowns, but its durability still needs to be tested. The next opportunity comes from watching how price behaves at support and resistance, then allowing the chart to establish whether buyers or sellers have the stronger hand.
This article summarizes technical analysis discussed on Verified Investing's Trading the Close. The analysis is for educational and informational purposes only and does not constitute personalized financial advice. Technical levels and market scenarios are subject to change, and no trading outcome is guaranteed.
Trading involves substantial risk. All content is for educational purposes only and should not be considered financial advice or recommendations to buy or sell any asset. Read full terms of service.