My Trading Game Plan Revealed - 11/05/2026: AI Trade Unwind Triggers 50% Tech Rout and High-Probability Swing Trades

S&P 500 Holds Bullish Structure as AI Stocks Sell Off: Gareth Soloway's Trading Game Plan for November 5
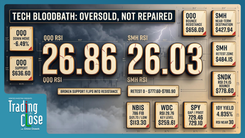
The S&P 500 continues to hold a constructive technical pattern, even as several of the market's biggest artificial intelligence and semiconductor names face significant selling. That divergence is shaping the trading environment, with weakness in technology creating potential swing trade opportunities while the broader index has yet to confirm a comparable breakdown.
During the November 5 edition of My Trading Game Plan, Verified Investing Chief Market Strategist Gareth Soloway examined the growing separation between the major indices, identified technical support levels across beaten-down technology stocks, and explained how he approaches entries when volatility accelerates. His framework centers on patience, predefined price levels, and recognizing when an extended decline creates a potential trading opportunity without assuming the correction has ended.
S&P 500 Bull Flag Holds as Nasdaq and AI Stocks Weaken
The S&P 500 remains technically constructive on the daily chart, with price action consolidating inside a bull flag formation. The pattern follows a strong advance and reflects a period of sideways movement as the market works through earlier gains. Importantly, the index has continued to hold its lower support area, preserving the broader bullish structure despite weakness in several major technology stocks.
That resilience stands in contrast to the Nasdaq, where selling across artificial intelligence and semiconductor names has damaged individual charts and weakened sector leadership. Nvidia and other AI-related companies have broken important technical levels, raising questions about how much additional selling the sector could experience before establishing more durable support. For Gareth, the divergence provides useful information about where market strength remains and where traders may find opportunities created by excessive selling.
The distinction between a short-term trading opportunity and a long-term investment bottom remains central to his approach. Stocks that have declined sharply can produce meaningful rebounds from technical support, even when their larger trends remain damaged. Gareth also cautioned that speculative sectors can experience much deeper retracements during prolonged corrections. That possibility makes position sizing, entry selection, and profit-taking particularly important when trading oversold technology stocks.
AI Stock Selloff: Marvell, ARM and Qualcomm Support Levels
The correction in AI-related stocks has brought several companies toward areas of historical technical interest. Gareth highlighted Marvell Technology, ARM Holdings, and Qualcomm as examples of how he evaluates declining stocks using pivot lows, gap fills, and overlapping support levels. The objective is to identify locations where buyers may respond, while allowing for the possibility that selling continues beyond the first support area.
Marvell Technology (MRVL) has experienced a steep decline, bringing its chart toward a combination of a prior pivot low and a gap fill. Gareth discussed an initial position and identified an area below $150 as a potential location for further accumulation. The appeal of that region comes from the technical structure rather than the percentage decline alone. A reaction from support could create a swing trade opportunity, although a sustained breakdown would require reassessing the setup.
ARM Holdings (ARM) has also experienced significant weakness following earnings, with the article's referenced chart showing a decline from an October high near $317 toward the $176 area. Gareth identified the $165 to $157 region as an important support zone. That area could attract buyers looking for an oversold rebound, particularly after an extended decline. Traders would still need to evaluate the quality of any reaction and recognize that an initial bounce does not necessarily establish a lasting bottom.
Qualcomm (QCOM) presents a similar situation following its earnings-related decline. Gareth identified $145 to $143 as a shorter-term reaction area, while his preferred swing trade support sits considerably lower, around $133 to $125. The lower zone is the more relevant reference for traders operating on a multi-day timeframe. Its importance comes from the combination of a gap fill and technical trend lines, which creates a more defined area for evaluating a potential entry.
Gareth Soloway's Scaling Strategy for Oversold Stocks
Gareth's approach to these setups involves entering positions in stages around predefined technical levels. Rather than committing an entire allocation at the first support area, he may establish an initial position and add at lower levels if the chart continues to support the trade. This allows him to account for the difficulty of identifying an exact low during a volatile decline.
The method requires a defined risk framework. Scaling into a declining stock increases exposure, and additional purchases can magnify losses if support continues to fail. Gareth's broader emphasis is on using chart structure to guide position management while remaining willing to take profits into a rebound. The goal is to capture a favorable reaction from an oversold condition without requiring the stock to recover its previous highs.
Micron and AppLovin: How Market Sentiment Shapes Trading Opportunities
Market sentiment was another important theme in Gareth's analysis, particularly in sectors where investors have shifted rapidly between optimism and pessimism. He used Micron and AppLovin to illustrate how extreme expectations can influence valuations and create trading opportunities when price reaches significant technical areas.
Micron Technology (MU) provides an example of the risks associated with extrapolating strong cyclical earnings indefinitely. Semiconductor companies can appear inexpensive based on price-to-earnings ratios when profits are near a cyclical peak. If earnings subsequently decline, that apparently low valuation may offer less protection than investors expect. Gareth's broader point was that historical earnings cycles and chart structure should be considered alongside current valuation multiples.
AppLovin (APP) offered a different sentiment setup. Concerns about artificial intelligence disrupting advertising businesses contributed to a negative narrative around the company. Gareth highlighted how the stock reached an important gap fill and pivot support area as sentiment weakened. The subsequent premarket recovery illustrated how a stock can rebound when expectations have become sufficiently negative and buyers respond at a technical level.
These examples reinforce the importance of combining sentiment with price structure. Extreme optimism can accompany vulnerable charts, while widespread pessimism can develop near areas where a rebound becomes possible. Sentiment alone does not establish an entry. The technical setup provides the reference point for evaluating whether the market is beginning to respond differently.
SanDisk and Seagate: Data Storage Stocks Approach Major Support
Selling across technology has also affected data storage companies, including SanDisk and Seagate. Both names have experienced substantial price swings, creating areas where Gareth is watching for potential reactions. Their charts reflect the broader pressure on AI-related technology, but each has its own technical levels that determine where a trade may become attractive.
Seagate Technology (STX) is approaching a support region associated with a prior pivot low and gap fill. Gareth identified the area from approximately $470 to $465, extending toward $430, as a potential reaction zone. The overlapping technical references make this an area of interest for swing traders, although the wide range also reflects the importance of allowing for continued volatility before assuming buyers have regained control.
SanDisk (SNDK) has experienced a more pronounced deterioration in its technical structure. Gareth discussed a possible shorter-term reaction around $900, while identifying a deeper support region between approximately $775 and $725 for swing trading consideration. The $772 area stands out within that broader zone. A rebound from support could be meaningful given the magnitude of the decline, but the damaged trend suggests that traders should distinguish between an oversold recovery and a confirmed reversal.
Coherent (COHR) and Unity Software (U) also appeared in the discussion. Coherent's weakness despite strong reported earnings highlighted the influence of broader sector selling, while Unity's advance toward resistance near $52 created a different technical consideration. Gareth emphasized the risks of pressing bearish trades after stocks have already experienced substantial declines, when even a temporary shift in buying activity can produce sharp countertrend moves.
Oil Price Breakdown Signals Weakness as Gold and Silver Hold Key Levels
Outside equities, Gareth examined a breakdown in crude oil following an extended period of consolidation inside a wedge pattern. Oil moved below the lower boundary of that formation, weakening its technical outlook and increasing the possibility of additional downside. The breakdown establishes a new reference for traders evaluating whether the previous support line begins acting as resistance.
A rebound toward the underside of the broken trend line would provide an opportunity to evaluate the strength of the move. If oil fails to reclaim that area, the bearish technical structure would remain intact. A sustained recovery back above the broken boundary would weaken the breakdown thesis. Geopolitical developments can still generate sharp price movements, but the chart currently favors a cautious approach to rallies.
Gold and Silver Technical Analysis: Resistance and Physical Accumulation
Precious metals present a different technical picture. Gareth described gold as maintaining a constructive recovery from a recent pivot low, with an overhead descending trend line providing the next resistance reference. The relationship between the recovery and that trend line will help determine whether momentum can extend or whether another period of consolidation develops.
Silver remains particularly interesting because Gareth separates his longer-term physical holdings from shorter-term trading decisions. He discussed purchasing physical silver after prices moved into the $49 range, viewing that decline as an attractive opportunity within his longer-term framework. At the same time, he identified resistance around $53.50 to $54 and acknowledged the possibility of further weakness toward $45 or even $40.
The two approaches involve different holding periods and risk considerations. A long-term physical purchase can be based on a broader accumulation thesis, while a swing trade requires closer attention to entry levels, resistance, and the potential for a near-term reversal. Gareth's analysis illustrates why traders should establish their timeframe before interpreting a support or resistance level.
Bitcoin Price Analysis: $75,500 Support and $81,000 Resistance
Bitcoin provided a clear example of how technical levels can frame a volatile trading session. Gareth highlighted the cryptocurrency's recent reaction from support near $75,500, followed by a rally toward resistance around $81,000. The move demonstrated how a market can travel between established technical reference points in a relatively short period.
For traders, the significance lies in how price behaved around those areas. The response near $75,500 showed that buyers were willing to defend the support region, while the move toward $81,000 brought Bitcoin into an area where selling interest could emerge. Both levels offer useful context for evaluating subsequent price action, although neither guarantees the direction of the next move.
The next technical signals will come from Bitcoin's ability to sustain a recovery through resistance or its failure to maintain support during another pullback. A confirmed move above $81,000 would strengthen the immediate bullish case, while renewed weakness below $75,500 would challenge the recent rebound structure. Gareth's broader lesson is that traders benefit from establishing these reference points before volatility accelerates.
Trading Psychology: Managing Volatility Without Chasing Price
Gareth also addressed the psychological demands of trading in an environment where large price swings can occur across multiple markets and timeframes. Extended trading access creates more opportunities to observe price action, but it can also increase the temptation to react to every move. That becomes especially challenging when technology stocks are falling sharply and market sentiment changes from one session to the next.
Volatility can create attractive technical setups because emotional buying and selling sometimes push prices toward extremes. However, those conditions also make risk management more demanding. Traders who chase an extended rally or sell into an established support area may find themselves reacting to the same price movement that a prepared trader has already incorporated into a plan.
Gareth's framework emphasizes identifying gap fills, pivot lows, trend lines, and resistance levels in advance. These references provide a basis for evaluating risk and potential reward while reducing the influence of short-term emotion. A predefined plan cannot eliminate losses or guarantee favorable execution, but it can help traders respond more consistently when markets become unsettled.
Bottom Line: S&P 500 Strength and AI Stock Weakness Create a Selective Trading Market
The November 5 market picture remains divided. The S&P 500 continues to hold a constructive bull flag, while selling across AI-related technology stocks has brought several names toward important technical support levels. Gareth's analysis suggests that this environment favors selective entries and disciplined risk management rather than broad assumptions about where the entire market is headed.
Marvell, ARM, Qualcomm, Seagate, and SanDisk offer different potential reaction areas, with the strongest setups depending on how price behaves when those levels are tested. Oil's breakdown presents a separate bearish framework, while silver and Bitcoin demonstrate how support and resistance can guide decisions across different holding periods.
The central lesson from Gareth's game plan is straightforward: prepare for volatility by identifying the levels that define a trade, manage exposure when price moves against the initial entry, and recognize that an oversold rebound can occur within a larger downtrend. Technical levels provide a framework for making decisions. Discipline determines how that framework is applied.
This article summarizes market commentary and technical analysis for educational and informational purposes only. It is not personalized financial advice or a recommendation to buy or sell any security or asset. Trading and investing involve risk, including the possible loss of principal. Technical analysis does not guarantee future results.
Trading involves substantial risk. All content is for educational purposes only and should not be considered financial advice or recommendations to buy or sell any asset. Read full terms of service.