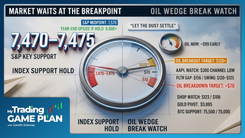
Trading The Close Market Recap - 11/04/2026: Post-Election Rally - S&P 500 Reversal, SMH Bounce, Oil Collapse & Bitcoin Resistance

S&P 500 Reclaims Support After Election as Semiconductors and Bitcoin Face Key Tests
The biggest takeaway from Wednesday's market wasn't simply that stocks rallied after the midterm elections. It was how quickly buyers regained control after overnight weakness, and whether that recovery can hold as several major markets approach important technical levels.
On the November 4 edition of Trading the Close, Verified Investing Pro Trader Drew Dosek examined the recovery in the S&P 500 and Nasdaq 100, the developing support setup in semiconductors, and the resistance levels still limiting Bitcoin's upside. With earnings season adding another layer of volatility, the charts are presenting opportunities, but not every strong move deserves to be chased.
The broader market has improved technically, particularly after buyers reclaimed levels that had recently been lost. The more important question now is whether that strength can carry through resistance or whether the recovery begins to lose momentum as traders digest the election results and upcoming economic data.
S&P 500 Reclaims Key Support as Post-Election Rally Gains Momentum
The S&P 500 reversed its overnight weakness and finished Wednesday with a 1.65% gain, reclaiming an important horizontal level associated with the June highs. That recovery matters because the same area has repeatedly influenced price action, acting as both support and resistance.
Drew connected part of the market's response to the reduction in political uncertainty following the midterm elections. Markets often struggle to price outcomes when the political landscape remains unsettled. Once results become clearer, investors can begin reassessing potential policy changes, sector exposure, and positioning.
That does not mean an election result automatically produces a sustainable rally. It means one source of uncertainty has been reduced, allowing traders to focus more directly on the price action.
From a technical perspective, the S&P 500 has been developing a bull flag following an earlier advance. The pattern consists of a strong upward move followed by consolidation, with buyers attempting to defend support rather than surrender the previous gains.
Wednesday's recovery strengthened that setup. The next area Drew identified was an ascending resistance trend line near 771.06 on the chart referenced during the show, followed by the broader 775 region. These are areas where traders can assess whether the recovery has enough momentum to continue.
The bullish case improves if the index holds its reclaimed support and begins clearing overhead resistance. A sustained move back below that support would weaken the breakout thesis and raise the possibility that Wednesday's recovery was temporary.
For now, the important development is that sellers failed to generate sustained downside follow-through, while buyers were able to regain a technically meaningful level.
Nasdaq 100 Approaches $700 as QQQ Tests Its Recovery
The Nasdaq 100 participated in Wednesday's recovery, with the Invesco QQQ Trust (QQQ) gaining approximately 0.97%. Although the move was smaller than the S&P 500's advance, the technical response was constructive.
Earlier in the week, QQQ had closed beneath an important support area. Rather than accelerating lower, price recovered, suggesting that sellers had not established lasting control beneath that level.
The next significant hurdle is the $700 region.
Round-number levels can become important because traders frequently use them to establish entries, exits, and risk parameters. Their significance increases when they overlap with prior consolidation or other technical reference points.
For QQQ, a confirmed daily close above $700 would strengthen the recovery and bring previous consolidation areas back into focus. A rejection would suggest that buyers still have work to do before establishing a more convincing continuation pattern.
The difference between the S&P 500 and QQQ is worth watching. Both recovered, but neither should be evaluated solely on the size of Wednesday's green candle. What matters is whether the recovery can hold and where buyers encounter their next meaningful test.
Semiconductor ETF SMH Tests Three-Factor Technical Support
One of Drew's more interesting technical observations involved the VanEck Semiconductor ETF (SMH), where several support factors have converged following a substantial pullback.
The setup combines a declining trend line that previously acted as resistance, the weekly 50-period moving average, and a prior wick low from the week of July 27. These separate technical references create a support area that deserves attention.
Drew also discussed the relationship between price and longer-term moving averages. Historically, extended moves into major moving-average support can produce meaningful reactions, particularly when other technical factors reinforce the same area.
That is the attraction of the current SMH setup. Rather than relying on one indicator, traders have multiple reference points to evaluate whether buyers are beginning to defend the pullback.
However, confluence should not be confused with confirmation. Three support factors do not guarantee a bounce, and they certainly do not guarantee an immediate return to all-time highs.
If SMH continues to hold this support area, Drew identified approximately $540 as an initial resistance zone based on previous price pivots. A recovery toward that level would provide an opportunity to evaluate whether the bounce is developing into something more substantial.
A decisive breakdown through the support confluence would weaken the bullish setup and require traders to reassess the structure.
The larger lesson is that the best technical locations are not necessarily the ones producing the biggest green candles. They are often the areas where traders can define what would confirm their thesis and what would prove it wrong.
Treasury Yields and the US Dollar Add Context to the Stock Market Rally
Wednesday's equity recovery was accompanied by notable moves in Treasury yields and the US dollar, both of which can influence risk appetite across financial markets.
The 10-year Treasury yield declined approximately 1.65% on a relative basis, moving beneath the midpoint of a parallel channel Drew has been monitoring. Continued weakness in yields could provide some support for equities by reducing pressure from borrowing costs and discount rates.
That relationship is not automatic. Falling yields can reflect changing growth expectations as well as improving financial conditions. Traders still need to evaluate why yields are moving rather than assuming that every decline is bullish for stocks.
The US dollar presented a different technical picture. After breaking above an ascending parallel channel dating back to August 2025, the dollar pulled back to retest the former upper boundary before finding buyers.
This is a familiar breakout-retest structure. Resistance becomes potential support, and the subsequent reaction helps determine whether the original breakout remains intact.
For traders following equities, commodities, and currencies together, these developments provide useful context. A weakening yield environment, a dollar holding technical support, and an equity market reclaiming important levels can coexist, but each chart still needs to confirm its own direction.
Gold and Silver Rally as Precious Metals Approach Resistance
Precious metals also benefited from Wednesday's market movement, with gold advancing and silver producing a particularly strong session.
Gold moved away from the support region Drew identified around $38.88 on the instrument displayed during the broadcast. The next resistance area sits near $41.04, a former support zone that influenced price action for several weeks.
The significance of that level comes from its history. When an established support area breaks, subsequent rallies can encounter selling as traders revisit positions established near the former floor.
A move into resistance does not automatically mean gold must reverse. It means traders should watch the reaction rather than assume that Wednesday's momentum will continue uninterrupted.
Silver gained approximately 4.93%, building on a constructive signal from the previous session. Although price had established a lower low, buyers stepped in and produced a pronounced lower wick on the daily candle.
That wick suggested selling pressure was being absorbed near the lows, creating the conditions for Wednesday's recovery.
Drew identified $54.50 as the next technical objective, with $59.28 representing a broader upside reference if momentum continues. The immediate test is whether silver can sustain its advance without quickly surrendering the recovery.
Both metals reinforce a theme running through Wednesday's charts: the reaction at established technical levels provides more useful information than the size of the daily move alone.
Oil Tests Support Near $86.90 as Natural Gas Holds Its Breakout
Energy markets showed a different response, with crude oil falling sharply while natural gas maintained a more constructive technical structure.
US oil declined toward $87.13 before finding a reaction near Drew's previously identified $86.90 support level. The move came amid uncertainty surrounding Middle East developments and the potential policy implications of the election.
Drew discussed whether the changed political landscape could affect expectations for future geopolitical escalation. That remains a possible market interpretation rather than an established explanation for the decline.
Oil is particularly sensitive to changes in perceived supply risk, and those expectations can shift quickly with new developments. For that reason, the $86.90 area is important as a technical reference, but it should not be treated as a guaranteed floor.
If buyers continue defending that region, a stabilization attempt could develop. A sustained break below it would suggest that the current selling pressure has not yet been absorbed.
Natural gas offered a contrasting setup. After closing above a key horizontal resistance level during the previous session, natural gas held that improvement and finished Wednesday around $3.19.
The next obstacle is a declining trend line that must be cleared before the $3.30 region becomes a more credible upside objective.
The contrast between oil and natural gas illustrates why traders should avoid treating the energy complex as one directional trade. Each market has its own technical structure, catalysts, and confirmation requirements.
Bitcoin Faces Resistance at $80,559, $81,890 and $82,758
Bitcoin recovered alongside other risk assets, but Drew's technical assessment remained more cautious than the broader equity picture.
Despite the rebound, Bitcoin had not established a confirmed daily close above a horizontal resistance level near $80,559, associated with a prior pivot from November 2025.
That level represents the first hurdle in a series of overhead resistance areas.
Above $80,559, the next reference is approximately $81,890, corresponding to the high of a significant bearish breakdown candle. Beyond that, a descending trend line creates another obstacle near $82,758.
The concentration of resistance between approximately $80,500 and $82,800 makes this an important area for determining whether the recovery has genuine strength.
A daily close above the first resistance level would improve the short-term picture, but it would not eliminate the additional barriers overhead. Bitcoin would still need to work through the breakdown-candle high and descending trend line.
Until those levels are reclaimed, the move remains a recovery within a structure that has not fully reversed its recent weakness.
This is where patience becomes important. A sharp bounce can attract attention, particularly after an extended decline, but a stronger technical case develops when price clears resistance and demonstrates that former selling areas can hold as support.
For now, Bitcoin's recovery deserves attention, but the chart has not yet delivered the same degree of confirmation seen in the major equity indexes.
Earnings Movers SWK and Block Show Why Chasing Strength Carries Risk
Earnings season continued to produce large individual stock moves, including sharp advances in Stanley Black & Decker (SWK) and Block (XYZ).
SWK gained approximately 13% following its earnings release, with the draft reporting a strong earnings-per-share surprise despite a slight revenue miss. The move also carried price above an ascending parallel channel, creating a technically significant breakout.
The concern is how extended the stock has become.
Drew identified a Relative Strength Index reading near 83.47, placing SWK in deeply overbought territory. An elevated RSI does not guarantee an immediate reversal, but it does indicate that momentum has moved well beyond typical conditions.
Rather than chasing the breakout, traders can monitor whether SWK consolidates or retests the former channel boundary near $110. A successful defense of that area would help establish whether the breakout can develop a more sustainable structure.
If the advance continues, Drew identified resistance near $129.68 and a higher Fibonacci reference around $139.56.
Block also advanced sharply, with the draft reporting a gain of approximately 15.3% and a closing price near $87. Despite the recovery, the stock encountered resistance at an ascending trend line.
That reaction matters because it shows where buyers began meeting supply, even during a strong session.
The next area to monitor is approximately $90, followed by the broader $99 to $100 region if the recovery continues. A rejection at the current trend line would keep the stock's larger resistance structure intact.
Neither chart supports the assumption that a strong earnings reaction automatically creates an attractive entry. Traders still need to evaluate the distance from support, the next resistance area, and the risk involved in entering after an extended move.
First Solar and Tilray Highlight the Limits of Post-Election Sector Rotation
Wednesday's election-related sector activity was especially visible in First Solar (FSLR) and Tilray Brands (TLRY), two stocks sensitive to changing expectations around government policy.
First Solar opened with a strong gap higher, approaching $200 before fading from its initial advance. The move suggested that early buying interest was not enough to sustain the opening momentum.
Drew's framework for this type of action is straightforward: a breakdown followed by a retracement can produce another rejection when price returns to resistance.
For FSLR, the important question is whether the stock can stabilize following the initial reaction. Support near $184.58 provides a reference for assessing whether buyers can establish a more durable base.
Tilray gained approximately 11.7%, with the draft placing its closing price near $2.67. The stock remains below a declining trend line around $2.84, making that level the immediate technical hurdle.
A confirmed daily close above $2.84 would improve the breakout case and bring $3.55 and $3.91 into focus as subsequent resistance areas.
However, the longer-term risks associated with speculative companies remain relevant. Dilution, profitability challenges, and policy uncertainty can all influence these stocks independently of short-term chart patterns.
Drew's broader point was not that traders should avoid every speculative name. It was that a short-term technical opportunity should not be confused with a long-term investment thesis.
What Traders Should Watch After the November 4 Market Recovery
Wednesday's session improved the technical picture for several major markets, but it did not resolve every important question.
The S&P 500 reclaimed a meaningful support area, while QQQ recovered from an earlier breakdown and moved closer to the $700 region. Both developments suggest that buyers have regained some control, although additional confirmation is still needed.
Semiconductors are testing an important support confluence, with SMH offering a useful example of how multiple technical factors can define a potential reaction area. Bitcoin faces the opposite challenge, with several resistance levels still stacked above its current recovery.
Meanwhile, the moves in precious metals, energy, and earnings-driven stocks demonstrate that market strength is not evenly distributed. Some charts are recovering from support, others are approaching resistance, and several remain vulnerable to sharp reversals.
Upcoming economic releases, including jobless claims, could introduce another catalyst. But the practical framework remains unchanged: identify the important levels before the reaction, evaluate how price behaves when those levels are tested, and avoid assuming that one strong session settles the broader trend.
The bottom line: Wednesday's rally gave buyers a stronger technical position, particularly in the major indexes. The next test is whether reclaimed support holds and overhead resistance begins to give way. Drew's approach remains focused on those confirmations, not on predicting how far a relief rally must travel.
This article is for educational and informational purposes only and does not constitute financial advice. Technical levels represent potential areas of market reaction, not guaranteed outcomes.
Trading involves substantial risk. All content is for educational purposes only and should not be considered financial advice or recommendations to buy or sell any asset. Read full terms of service.