My Trading Game Plan Revealed - 11/04/2026: Midterm Market Shock, Sector Rotation, and Critical Technical Levels

S&P 500 Holds Key Support as Election Volatility Tests Market Structure | Gareth Soloway's Game Plan
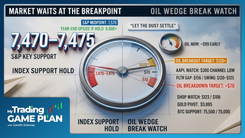
The S&P 500 is holding its broader bullish structure following a sharp overnight selloff and recovery, but the next test could determine whether buyers remain in control. In his November 4 edition of My Trading Game Plan, Gareth Soloway, Chief Market Strategist at VerifiedInvesting.com, identified the 7,475 to 7,525 support zone as the area that could define the market's next significant move.
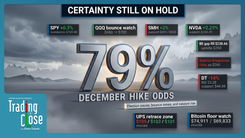
The overnight session saw Nasdaq futures fall more than 600 points before recovering into positive territory by the morning. Election-related uncertainty contributed to the volatility, while movements in technology stocks, precious metals, oil, and Bitcoin showed how quickly market expectations were shifting. Gareth's approach remained focused on technical structure, identifying where the charts support a trade and where that analysis would need to change.
Stock Market Reaction to the 2026 Midterm Elections
The overnight reversal provided an example of how quickly financial markets can adjust to political developments. Initial selling followed election-related headlines, but the subsequent recovery suggested that buyers were willing to absorb at least part of that pressure. For traders, the speed of the reversal raised an important question about whether the initial move reflected a lasting change in market expectations or a temporary reaction to uncertainty.
Liquidity can play an important role during overnight trading. With fewer participants and potentially thinner order books, relatively large orders can produce exaggerated price movements. As regular trading activity increases, prices may stabilize or reverse as additional buyers and sellers enter the market. That framework helps explain why an overnight decline does not necessarily establish the direction of the following session.
Gareth also discussed the historical tendency for equities to perform well following midterm elections, although historical patterns provide context rather than guarantees. Changes in congressional control can influence expectations for fiscal policy, regulation, and government spending. The market's response ultimately depends on how those expectations translate into earnings, interest rates, and capital flows. The technical levels provide a way to evaluate whether those developments are producing sustained buying or selling.
S&P 500 Technical Analysis: The 7,475 to 7,525 Support Zone
The S&P 500 remains the central chart in Gareth's market framework. Following a breakout above a descending trendline, the index continues to show a constructive technical structure. The broader upside objective remains near 8,000, provided the breakout holds and the market avoids a meaningful deterioration in its underlying support levels.
Gareth identified a particularly important support area between 7,475 and 7,525, where two technical trendlines converge. This confluence gives the zone greater significance than an isolated support level. A successful test could reinforce the bullish structure and support another attempt to extend the rally. The response within this range will help determine whether buyers continue defending the existing trend.
The lower boundary at 7,475 represents the more consequential level. A sustained break below it would weaken the current bullish thesis and expose the index to a potentially deeper decline. Gareth identified 7,000 as a possible downside reference if the support structure fails, although such a move would require further confirmation rather than following automatically from a single breakdown.
This framework establishes both the opportunity and the risk. The breakout supports the bullish case while the index holds its technical structure, but a confirmed loss of support would require traders to reassess that position. Gareth emphasized the importance of recognizing when a trade thesis is no longer supported by price action, rather than allowing an initial expectation to dictate the response.
AI Stocks and Data Center Spending Face Political Uncertainty
Technology stocks showed signs of changing expectations as investors considered the potential implications of the election for artificial intelligence infrastructure and data center development. The sector has benefited from substantial capital spending, but electricity demand, permitting requirements, and community opposition remain important considerations for future projects.
The original market discussion referenced concerns about potential delays to data center construction, including an estimate attributed to Goldman Sachs. Such delays could affect the timing of equipment purchases and infrastructure investment. Companies exposed to data center spending, including Oracle (ORCL) and Marvell Technology (MRVL), may be sensitive to changes in those expectations, although individual stock moves can reflect several factors beyond politics.
Gareth also examined the potential implications for companies connected to Elon Musk, including Tesla and SpaceX, alongside publicly traded aerospace businesses such as AST SpaceMobile (ASTS) and Rocket Lab (RKLB). Changes in government priorities could influence investor expectations for future contracts and spending. Those possibilities remain speculative until supported by actual policy decisions, contract announcements, or changes in company guidance.
The sector-level takeaway is that political developments can change expectations well before their economic effects become measurable. Traders can use relative strength, volume, and technical support to assess whether a shift in sentiment is developing into a more durable rotation.
Gold and Silver Technical Analysis: The $50 Silver Breakout Retest
Precious metals were another important focus of Gareth's November 4 analysis. A weaker U.S. dollar and movement in Treasury yields helped frame the discussion, with gold showing strong upside momentum. Changes in interest rates, real yields, and currency expectations can influence demand for precious metals, although those relationships are not consistent in every trading session.
Gold's reported advance of approximately $115 highlighted the strength of the move. Gareth also identified a resistance trendline as an important area for assessing whether the rally could continue. A rejection would suggest that sellers remain active at overhead resistance, while a confirmed breakout would strengthen the case for another move toward prior highs. The relevant resistance price should be confirmed against the specific gold instrument shown during the broadcast.
Silver offered a particularly clear example of Gareth's technical approach. After a powerful advance above $100 earlier in the year, the metal retraced toward the $50 area, a level connected to major historical price pivots. Gareth described this return to the original breakout region as a revisit to the "scene of the crime," where the market tests an area that previously marked a significant change in price structure.
According to the recap, Gareth accumulated physical silver in the low $49 range as prices revisited that support area. With silver subsequently trading back above $52, the reaction illustrated how a major breakout level can attract buying interest on a retest. The historical pivots from 1980 and 2011 provided additional technical context for the setup.
The strength of the analysis comes from the relationship between the original breakout, the retest, and the subsequent response. A sustained hold above the former resistance area would support the longer-term bullish interpretation, while a decisive breakdown would weaken the setup. The example also reinforces Gareth's preference for identifying important price levels in advance and allowing the market to approach them.
Oil and Bitcoin Price Levels: Support Tests Across Markets
Crude oil was moving in the opposite direction from precious metals, with prices declining toward a technical support area identified near $93.40. Gareth connected the weakness to changing geopolitical expectations and a possible reduction in the risk premium embedded in energy prices. Supply conditions, global demand, and geopolitical developments remain additional variables that can influence oil's direction.
The $93.40 level represents the immediate technical reference in the analysis. A successful defense could produce a reaction higher, particularly following a sustained decline. A confirmed break below support would increase the risk of additional selling and suggest that the market is repricing oil beyond the initial reaction. The distinction between testing support and breaking it remains important when evaluating the next move.
Bitcoin also demonstrated the relevance of former resistance becoming support. Following a pullback toward approximately $75,500, the cryptocurrency rebounded toward $78,200. Gareth identified the support test as an example of how a previously established technical level can influence price behavior after a breakout.
For Bitcoin, the next signal comes from whether buyers can maintain the recovered ground and build on the bounce. Holding above the support region would keep the constructive technical interpretation in place, while renewed weakness through that area would call the rebound into question. The reaction offers a useful reference for evaluating market strength without assuming that one successful test guarantees further upside.
AMD Earnings and Implied Volatility: Understanding Options Risk
Earnings volatility provided another important lesson from the session, particularly through the price action in Advanced Micro Devices (AMD). Ahead of its report, the options market was pricing an expected move of approximately 8% in either direction. That expectation reflected the premium traders were paying for uncertainty surrounding the earnings announcement.
Options prices incorporate several variables, including the underlying stock price, time remaining until expiration, and implied volatility. Implied volatility often rises ahead of major events because the range of potential outcomes is uncertain. Once the announcement is released, that uncertainty can decline sharply, producing what traders refer to as implied volatility crush.
Gareth used AMD's reported reaction near the expected-move boundary to explain why correctly anticipating a stock's direction does not always produce a profitable options trade. A call option can lose value even when the stock rises if the move is insufficient to offset the premium paid and the subsequent decline in implied volatility. The same principle applies to put options following a decline.
The expected move also should not be treated as a fixed ceiling or floor. Stocks can move beyond the options market's implied range, and the outcome for an individual contract depends on its strike, expiration, entry price, and changes in volatility. Understanding those mechanics helps traders evaluate the risk of entering an options position ahead of earnings rather than relying solely on a directional forecast.
Earnings Stock Watchlist: AMD, Arista Networks, SMCI, McDonald's and Datadog
Beyond the broader options discussion, Gareth highlighted several individual stocks where earnings-related price movements were creating technical areas of interest. These levels represent potential reaction zones from the session rather than confirmed trade signals, and each requires evaluation against the current chart before use.
Advanced Micro Devices (AMD): Gareth identified a support area near $450 and overhead resistance around $565 in the supplied recap. The immediate technical question is whether buyers can defend support following the earnings reaction or whether continued weakness changes the short-term structure.
Arista Networks (ANET): Following an earnings-related decline toward $175, Gareth identified a potential gap-fill area near $184. A rally into that zone could encounter selling interest, but the strength of the move and the reaction at resistance would determine whether a bearish setup develops.
Super Micro Computer (SMCI): After an initial earnings-related advance faded, Gareth highlighted a lower gap-fill area as a potential support reference. The original recap lists $2,866, a figure that requires confirmation against the chart and any applicable stock-split adjustments before publication.
McDonald's (MCD): The stock approached an identified resistance area near $277 following its earnings-related advance. Gareth's framework focused on whether sellers would defend that level or whether sufficient buying pressure could produce a sustained move above it.
Datadog (DDOG): The recap identified an aggressive intraday reaction level near $180, with a deeper gap-fill area around $143.30 potentially relevant to a longer-duration setup. These are different trading timeframes, and a reaction at either level would need to be evaluated within the appropriate chart structure.
Across the watchlist, the common approach is to establish where a stock could encounter support or resistance and then assess the price reaction. Earnings can create sharp moves and temporary dislocations, making confirmation and risk management especially important.
Gareth Soloway's Trading Game Plan: What Matters Next
The November 4 session reinforced the importance of maintaining a consistent technical framework during periods of elevated volatility. Election developments, sector rotation, earnings reports, and changes in macro expectations can all move prices quickly. Gareth's analysis connected those developments to identifiable support and resistance levels that help traders evaluate whether the underlying market structure is strengthening or weakening.
For the S&P 500, the 7,475 to 7,525 support zone remains the central reference, with the broader bullish case intact while the structure holds. Silver's return to its historical breakout area provides an example of a longer-term support test, while Bitcoin and oil illustrate how reactions at established levels can help define the next technical move. AMD's earnings reaction adds another layer by showing how options pricing can complicate an otherwise correct directional view.
The trading framework is straightforward: identify the important levels before price reaches them, evaluate the response, and adjust when the chart changes. The market can reverse sharply, particularly around major news events, but preparation provides a more consistent basis for decision-making than reacting to each headline.
This article summarizes market analysis attributed to Gareth Soloway for educational and informational purposes only. It is not personalized investment advice or a recommendation to buy or sell any security. Trading and investing involve risk, including possible loss of principal. Technical levels and market conditions can change, and past performance does not guarantee future results.
Trading involves substantial risk. All content is for educational purposes only and should not be considered financial advice or recommendations to buy or sell any asset. Read full terms of service.