Trading The Close Market Recap - 11/03/2026: Midterm Market Calm — Key Technical Levels for SMH, QQQ, Bitcoin & Oil

Stock Market Holds Key Support as Semiconductor Weakness Raises Questions After Election Day
The stock market finished November 3 with modest gains, but the more important story was what happened beneath the surface. Major indices held their technical support levels as traders awaited the midterm election results, while weakness in semiconductors continued to raise questions about the durability of the broader market.
On today's Trading the Close, Verified Investing Pro Trader Drew Dosek focused on the gap between short-term price action and the underlying technical structure. The S&P 500 and Nasdaq showed resilience, but several important charts remained vulnerable to further selling. The question heading into the next session is whether buyers can defend support and begin rebuilding momentum, or whether the recent weakness is setting up another move lower.
Election results, upcoming economic data, and earnings reactions could all influence the next move. For Drew, however, the approach remains the same: identify the important levels, watch how price reacts, and let the charts provide confirmation before committing to a directional thesis.
S&P 500 and Nasdaq Hold Support Ahead of Election Results
Election uncertainty was an important part of Tuesday's trading environment. With the midterm results still pending, market participants had reason to remain cautious about taking aggressive positions. Drew explained that investors generally prefer certainty because it gives them a clearer framework for evaluating the economic and policy environment.
That does not mean the election outcome automatically produces a rally. Removing one source of uncertainty can help markets reassess risk, but the price reaction still needs to confirm whether buyers are willing to step in. The technical levels established before the results remain important regardless of which direction the initial reaction takes.
The S&P 500 gained approximately 0.3%, holding above an inclining trend line near 749.78 at the upper portion of a larger parallel channel. That area remains an important near-term support reference. On the upside, horizontal resistance near 760.40 is the next level Drew is watching. A sustained move above that resistance would strengthen the bullish case, while a break of support would suggest the index is losing its recent stability.
The Nasdaq 100, tracked through QQQ, gained approximately 0.62%, but its technical structure deserves closer attention. Support remains intact for now, although a confirmed breakdown could expose the lower boundary of its parallel channel near 660. That would represent a meaningful decline from current levels and potentially create a new support test. A reaction from that area could eventually put 700 back into focus, but only if buyers demonstrate that they can regain control.
The takeaway is that positive index performance alone is not enough to establish a stronger market trend. The next test is whether those gains can hold as election uncertainty clears and traders respond to new information.
Semiconductor Stocks and SMH Signal a More Important Market Test
One of Drew's most important charts was the VanEck Semiconductor ETF (SMH). Semiconductors are closely tied to growth expectations and technology-sector risk appetite, making their performance a useful reference for evaluating the broader market.
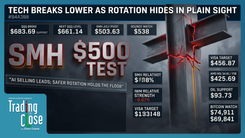
While the major indices remained relatively stable, Drew highlighted five consecutive declining weekly candles in SMH. That weakness creates a divergence worth monitoring. The broader market has not broken down decisively, but a key leadership group has already experienced sustained selling.
The next major support area sits between 495 and 503.63, where the 50-week moving average near 495 approaches a previous pivot low at 503.63. Two technical references converging in the same area make this an important zone for a potential buyer response.
Drew's framework focuses on how price reaches and reacts to that support. A sharp decline into the zone followed by strong buying could establish the conditions for a recovery toward the 20-week moving average near 570. That would represent a meaningful technical bounce, although the broader trend would still require additional confirmation.
A different reaction would carry a different message. If SMH reaches the support area and spends an extended period moving sideways without attracting stronger buying, the level could become increasingly vulnerable. Repeated tests of support do not guarantee a breakdown, but they can indicate that demand is struggling to produce a sustained recovery.
This is why semiconductor performance deserves particular attention over the next several sessions. If SMH stabilizes while the indices hold their own support levels, the broader market could begin rebuilding momentum. If semiconductor weakness accelerates, the modest gains in the major indices may prove less durable than they initially appear.
Treasury Yields, Gold, and Silver Add to the Technical Picture
The 10-year Treasury yield remained within a consolidation range that has developed over roughly eight to nine trading sessions. Drew highlighted the midpoint of a larger parallel channel dating back to March 2023, where several recent daily candles have formed lower wicks.
Those repeated wicks suggest buyers have been responding near the same technical area. They do not confirm that yields are ready to move higher, but they establish a support reference worth monitoring. If the yield holds that area and begins advancing, Drew identified 5.08% as a potential resistance target.
A renewed rise in Treasury yields could become another factor for equity traders to consider, particularly if technology stocks remain sensitive to changes in interest-rate expectations. For now, the yield chart is still consolidating, making confirmation more important than anticipating a breakout.
Gold and Silver Face Different Technical Tests
Gold remained in a narrow consolidation range, with Drew identifying boundaries near 38.86 and 39.50 on the chart instrument discussed during the show. The concern is that price continues to move sideways near support without generating a convincing recovery.
If the lower boundary fails, the next downside reference sits near 36.20. Drew also identified a broader gold-price area near $3,500 as a potential support reference. These levels should be evaluated in the context of their respective instruments rather than treated as interchangeable prices.
Silver showed a different pattern. After making a lower low, it recovered some ground, but the larger technical structure remains vulnerable. Drew highlighted $59.32 as an important reference near the midpoint of a long-term parallel channel extending back to January 2008.
The current setup resembles a breakdown followed by a retest of former support. When a broken trend line begins acting as resistance, a recovery can lose momentum before the prior trend resumes. Silver needs to reclaim and hold the relevant technical area to weaken that bearish interpretation.
Both metals reinforce a familiar lesson: a bounce from support is only the beginning of a potential reversal. The follow-through determines whether the market has actually changed direction.
Oil and Natural Gas: Support Holds, but Confirmation Still Matters
Crude oil declined sharply before finding buyers near an inclining trend line established in early July. The reaction kept near-term support intact, even as geopolitical headlines added uncertainty to the energy market.
Drew's larger oil chart includes an inverse head and shoulders structure, with a declining neckline serving as a potential breakout reference. A confirmed move above that neckline would strengthen the bullish interpretation and bring a measured-move projection near $148 into consideration. That is a conditional technical objective, not a forecast that oil must reach that price.
On the downside, a confirmed break of the current rising support trend line would weaken the near-term structure and bring the $86.90 area into focus. Until one side establishes control, the chart remains a contest between support and resistance.
Natural gas showed relative strength, recovering above a previous support level near $3.14. Holding that reclaimed area would keep the next declining trend-line resistance near $3.19 in play. The distance between those levels is relatively small, so traders need to account for the limited room before the next technical obstacle.
Bitcoin's Bounce Has Not Yet Changed the Bearish Structure
Bitcoin gained approximately 1.47% during the session, but Drew cautioned against interpreting a single positive day as evidence of a completed reversal.
The larger chart continues to show a sideways-to-lower pattern, with rallies struggling to establish sustained upside momentum. If that structure persists, the next downside reference sits near $74,911, just below the psychologically important $75,000 level.
A deeper decline could bring $69,833 into focus. That area sits near the lower boundary of a rising parallel channel extending back to 2021, creating a longer-term technical support reference. The convergence of the channel boundary and the $70,000 psychological level makes it an area worth monitoring, although neither guarantees a reversal.
Drew also addressed the importance of identifying chart patterns correctly. Bitcoin's recent structure may resemble an inverse head and shoulders at first glance, but the neckline does not meet the criteria he uses to validate that formation. Rather than forcing a bullish pattern onto the chart, he is treating the current price action according to the support, resistance, and trend structure already established.
That approach is particularly important in cryptocurrency markets, where sharp countertrend rallies can occur without changing the larger directional picture. Bitcoin needs to demonstrate stronger technical confirmation before the recent bounce can be treated as a meaningful shift in momentum.
Earnings Season Exposes Failed Breakouts and Overextended Stocks
Earnings-related volatility created several notable setups, but two charts stood out for different reasons: Dynatrace (DT) and UPS. One illustrated the risk of a failed breakout, while the other showed why waiting for a pullback can be more useful than chasing an extended move.
Dynatrace (DT): Failed Breakout Shifts Focus to Fibonacci Support
Dynatrace declined approximately 14%, reversing an earlier breakout above a significant pivot high. Drew used the move to explain why failed breakouts deserve attention. When price moves above resistance but cannot sustain the advance, traders who entered on the breakout may be forced to reassess their positions as the stock falls back below the level.
The next technical reference sits near $44.88, where a 61.8% Fibonacci retracement aligns with a gap-fill area. That confluence could attract buyers looking for a short-term reaction.
The daily RSI reading near 23.28 also indicates oversold conditions. However, oversold readings can persist during strong declines, so they should not be treated as confirmation that the selling is finished.
If buyers respond near $44.88, the stock could develop a technical bounce. If that support fails, Drew identified $39.05 as a deeper downside reference. The lesson is not that an oversold stock must recover, but that failed breakouts can change the risk profile quickly, making confirmation and defined invalidation especially important.
UPS: Waiting for the Pullback Instead of Chasing Strength
UPS presented the opposite situation. The stock had advanced sharply after breaking above a long-term declining trend line extending back to February 2022. The breakout was technically constructive, but the speed of the move left the stock extended, with the daily RSI near 74.4.
Rather than treating the strength as a reason to chase, Drew focused on where a pullback might offer a more favorable technical setup. The original breakout area and nearby support references around $105, $103, and $101 provide levels to monitor if the stock begins retracing.
A controlled pullback into support, followed by renewed buying, would be more constructive than an uncontrolled decline through those levels. If a valid bounce develops, the open gap near $112.85 becomes a potential upside objective.
UPS illustrates an important part of Drew's approach: identifying a bullish chart does not mean every price offers the same opportunity. The entry location, distance to resistance, and invalidation level all affect whether the setup is worth considering.
Nvidia, AMD, and Semiconductor Earnings Remain in Focus
Nvidia (NVDA) gained approximately 2.29%, although the daily candle reflected selling from higher intraday levels. The stock has spent several sessions trading beneath a parallel channel, but Drew noted that the breakdown has not yet received the confirmation he wants to see.
That leaves Nvidia in an unresolved technical position. A recovery into the channel would weaken the bearish interpretation, while continued selling and a confirmed lower close could bring support near $194.49 into focus. With the next earnings catalyst approaching, traders have an additional reason to respect the difference between an intraday move and a confirmed change in structure.
Bloom Energy (BE) provided a useful comparison. After briefly trading beneath its own parallel channel, the stock recovered back inside the structure. That recovery demonstrates how an apparent breakdown can fail when sellers cannot maintain control. Drew identified a gap-fill area near $238.66 as the next resistance reference, with $260 representing a larger potential upside objective if momentum continues.
AMD, SMCI, and Astera Labs: After-Hours Levels to Watch
After-hours earnings reactions added another layer of volatility to the semiconductor group. AMD rallied following the regular session, but Drew's focus remained on resistance near 536.89. Even after a strong earnings response, a stock approaching overhead resistance still needs to demonstrate that buyers can absorb supply at that level.
Super Micro Computer (SMCI) also recovered from an after-hours decline, moving away from a low near $30.70. Drew had been watching a 78.6% Fibonacci retracement area near $28, but price turned higher before reaching it. The next resistance reference sits near $38.94, making that level important if the recovery extends.
Astera Labs (ALAB) experienced a volatile after-hours move as well, with price recovering toward the underside of a previously broken parallel channel. Resistance near $255.69 is the first technical hurdle. A stronger recovery would require the stock to reclaim the channel structure, with $303.25 identified as a higher reference if that occurs.
These earnings reactions reinforce the importance of distinguishing a strong price move from a completed technical breakout. After-hours volatility can change the location of a stock relative to support and resistance, but the next regular session provides another test of whether those moves can hold.
Stock Market Outlook: What Traders Should Watch After the Midterms
The election results may remove one source of uncertainty, but they will not eliminate the technical challenges already visible across the market. The S&P 500 and QQQ are holding important areas, while semiconductor weakness, earnings volatility, and unresolved macro charts continue to complicate the broader picture.
The most useful watchpoints for the next session are the S&P 500's support near 749.78 and resistance near 760.40, the SMH support zone between 495 and 503.63, and whether QQQ can maintain its current structure. These charts provide a clearer view of market participation than the direction of the opening move alone.
Traders should also monitor how earnings-driven gaps behave once regular trading resumes. A stock that opens sharply higher but immediately loses an important resistance level tells a different story from one that holds its gains and establishes support. The same principle applies to Bitcoin, metals, and energy, where several potential reaction zones have yet to produce confirmed reversals.
The next economic releases and changing interest-rate expectations could introduce additional volatility. Rather than assuming those catalysts will favor one direction, Drew's framework is to prepare the relevant technical levels in advance and evaluate the market's response.
Bottom Line: Support Is Holding, but Buyers Still Have Work to Do
November 3 was not a decisive breakout day for the broader market. The indices finished higher, but the underlying technical picture remains mixed, particularly with semiconductors showing sustained weakness.
Drew's central takeaway is that traders should not confuse holding support with confirming a new uptrend. Support establishes where buyers may respond. What happens after that response determines whether the market is building a stronger foundation or simply pausing before another decline.
For now, the S&P 500 and Nasdaq remain at important decision points, SMH is approaching a significant weekly support zone, and several earnings-driven stocks are testing the boundaries of their technical structures. The next session should provide additional evidence about which side is gaining control.
The priority is not predicting the post-election move. It is knowing which levels would confirm it, which would invalidate it, and where the risk changes.
Trading involves substantial risk. All content is for educational purposes only and should not be considered financial advice or recommendations to buy or sell any asset. Read full terms of service.