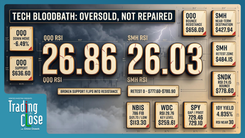
My Trading Game Plan Revealed - 11/06/2026: AI Bubble Collapse Triggers VIX Buy Signal and Semiconductor Bargains

AI Stock Sell-Off Creates Buying Opportunities as Gareth Soloway Watches Nvidia, Gold and Bitcoin
A sharp sell-off in artificial intelligence and semiconductor stocks has pushed fear back into the market, with several technology names extending declines that were already significant. For Gareth Soloway, Chief Market Strategist at VerifiedInvesting.com, the selling has brought a number of stocks closer to technical levels he has been waiting to see. Rather than chasing the market lower, Gareth has been looking for opportunities where panic selling, established chart support, and improving valuations begin to align.
During the November 6 edition of My Trading Game Plan, Gareth explained why emotionally driven sell-offs can create attractive trading setups, even when the broader market remains vulnerable. His analysis focused on the VIX, major semiconductor stocks, post-earnings opportunities, gold, silver, oil, and Bitcoin. The common thread was discipline: identify the levels ahead of time, understand why they matter, and manage the trade without assuming that a short-term bounce means the correction is finished.
Market Panic and the VIX: Why Gareth Is Looking for Buying Opportunities
One of the clearest signs of changing market sentiment has been the sharp increase in volatility. The CBOE Volatility Index (VIX), commonly referred to as Wall Street's fear gauge, moved toward the 30 level during the sell-off. That area has historically been associated with elevated investor anxiety and, in some cases, short-term market bottoms. Gareth views these conditions as a reason to begin looking more closely at buying opportunities, particularly when individual stocks are reaching significant technical support.
The psychology behind these moves is familiar. Investors who were comfortable buying stocks near their highs often become reluctant to buy those same companies after substantial declines. As prices fall, expectations for further losses increase, and selling can accelerate as traders react to the immediate price action. This creates the possibility that otherwise attractive stocks become temporarily oversold, although fear alone cannot establish where the final low will occur.
Gareth described the type of environment that gets his attention:
"When you get these kind of panic sell-offs that are emotionally driven, that have no fundamental backing, nor basically nothing else backing the sell-off itself, except for fear and panic, that's when I want to step up."
He illustrated the psychology with a simple comparison. If a high-quality Ferrari suddenly went on sale at a substantial discount, buyers would likely see an opportunity. Yet investors often respond to falling stock prices by becoming more fearful, even when the underlying business remains strong. The comparison highlights an important part of Gareth's approach: a lower price can improve a potential entry, but the chart and fundamental backdrop still need to support the trade.
For traders, a VIX reading near 30 provides useful context. It suggests that fear has become elevated enough to warrant attention, particularly when price is approaching a well-established support level. The next step is evaluating whether that support can produce a meaningful reaction and whether the potential reward justifies the risk.
Strong Jobs Data Takes a Back Seat to the Technology Sell-Off
The broader economic backdrop also featured in Gareth's analysis. The employment figures cited during the discussion showed nonfarm payroll growth of 165,000 against expectations of approximately 65,000, an unemployment rate of 4.1%, and average hourly earnings growth of 0.4% compared with a 0.3% forecast. Taken together, those figures would suggest a labor market holding up better than expected, although the release details require confirmation before publication.
Ordinarily, stronger employment data could have a significant influence on equity markets, Treasury yields, and expectations for Federal Reserve policy. In this case, the selling pressure across technology stocks dominated the immediate market discussion. Gareth's broader point was that the market's reaction to a particular economic report can be overshadowed when positioning, sentiment, and technical breakdowns are driving price action.
The employment backdrop remains relevant because it complicates the argument that the economy is already entering a severe contraction. Stronger hiring and wage growth may support consumer spending and corporate earnings, although they can also affect expectations for interest rates. Gareth's framework leaves room for both considerations while focusing on the technical conditions developing across equities.
That combination helps explain why he has been willing to examine beaten-down technology stocks. A sharp decline in price does not necessarily mean the underlying business has deteriorated to the same degree. When the market begins pricing in substantially worse conditions, established technical support can become an area where traders reassess the balance between risk and potential reward.
Nvidia Stock: Major Technical Support Meets Lower Valuations
Nvidia (NVDA) was one of the most important charts in Gareth's discussion. Following the technology sell-off, the stock had returned to a significant support area near $178 to $181. This zone includes a prior technical pivot and a trendline that previously acted as resistance before the stock broke higher. Following that breakout, the same area has served as support on subsequent tests.
The significance of the setup comes from the history of the level. A former resistance area that later becomes support can attract buyers because it represents a price zone where market participants have previously demonstrated interest. Nvidia's return to that area, combined with a nearby gap fill, gives Gareth multiple technical reasons to watch for a potential reaction. A sustained breakdown below the zone would weaken the immediate support thesis and require reassessment.
Gareth also considered the valuation backdrop. The original analysis described Nvidia's forward price-to-earnings multiple as having compressed significantly during the decline, potentially making the stock more attractive relative to its expected earnings. Those exact multiples should be verified against current estimates, but the underlying principle remains useful: a falling stock price can improve valuation if earnings expectations remain relatively stable.
For Nvidia, the opportunity is built around the alignment of technical support and a more attractive valuation. Gareth is watching whether buyers respond to the $178 to $181 area and whether that response develops into a sustainable bounce. The level provides a defined reference point, while the broader semiconductor sector remains an important influence on the stock's near-term direction.
Marvell, Micron and SanDisk: Semiconductor Stocks Approach Key Support
The selling has extended beyond Nvidia, with Marvell Technology (MRVL), Micron Technology (MU), and SanDisk (SNDK) also featuring in Gareth's analysis. These companies have different businesses and earnings drivers, but their charts illustrate how quickly market sentiment can shift when a heavily favored sector begins correcting. Gareth is particularly interested in stocks that have returned to established support following substantial declines.
Marvell's chart shows a notable support area around $128 to $130, where a prior breakout and a gap fill come into focus. The stock's retreat toward this zone represents a test of an earlier technical structure that helped support its advance. Gareth is watching for buyers to defend the area, with a failure to hold potentially opening the door to additional downside. The setup offers a clearer trading reference than attempting to predict the low during the initial selling wave.
Micron and SanDisk present a related opportunity through their exposure to the memory and storage markets. The original analysis highlighted how sharply their forward earnings multiples had compressed, with Gareth considering whether valuations had become unusually low relative to the companies' earnings potential. However, semiconductor earnings are cyclical, and low forward multiples can also reflect expectations that current profitability will weaken. That risk is especially important when assessing memory-related businesses.
Gareth's approach combines those valuation considerations with the charts. Oversold conditions and substantial price declines may increase the potential for a bounce, particularly when they coincide with support, but they do not eliminate the possibility of further losses. His focus is on identifying areas where the downside has become extended and the market may be positioned for a technical recovery.
DraftKings, Atlassian and Cloudflare: Trading Around Earnings Volatility
Earnings season has created another set of opportunities, although Gareth is applying a more selective approach to individual stocks. Sharp post-earnings moves can push prices into important technical areas quickly, but the reason for the move also deserves attention. A company facing a temporary reaction to earnings expectations presents a different setup from one experiencing a meaningful change in its competitive position or long-term outlook.
DraftKings (DKNG) has been under pressure, with Gareth highlighting the company's increasingly competitive operating environment. Traditional sports betting platforms face competition from established operators and newer prediction-market products, potentially affecting customer acquisition costs, market share, and margins. These considerations make Gareth more selective about where he would consider a longer-duration position.
On the chart, he identified approximately $15.75 as a potential short-term reaction level, while the more significant swing-trading area sits closer to $11. The difference reflects the amount of technical support he wants to see before considering a position intended to be held beyond an intraday bounce. A brief reaction at $15.75 would not, by itself, establish that the broader downtrend has ended.
Atlassian (TEAM) presents a similar separation between short-term and swing-trading levels. Gareth identified a gap area near $144 that could produce an intraday reaction, while a deeper support zone near $111 combines a lower gap fill with a former pivot. The $111 area carries greater significance for a potential swing setup because it brings together multiple technical reference points.
Cloudflare (NET), meanwhile, was moving sharply higher in premarket trading. Gareth identified possible resistance around the $318 gap fill, followed by another area near $333. These levels could be relevant for short-term traders watching for a reaction after the advance. Given the volatility across technology stocks, Gareth was not treating them as swing-short setups. A strong move through resistance would also weaken the case for an immediate reversal.
Across these earnings-driven charts, Gareth's method remains consistent. A stock moving sharply in either direction can create an opportunity, but the entry needs to be supported by a defined technical level and a trade horizon that fits the setup.
Gold and Silver: Safe-Haven Demand Returns as Technology Stocks Fall
Gold has begun showing a change in behavior relative to the technology sector. Earlier in the market cycle, the metal often moved alongside risk assets, including periods when both gold and technology stocks advanced or declined together. More recently, Gareth observed gold attracting buying interest during weakness in equities, suggesting that some investors may be returning to the metal for its traditional defensive characteristics.
That shift is relevant because gold's relationship with other asset classes can provide information about market sentiment and capital allocation. If gold continues to attract demand during equity weakness, it would strengthen the case that investors are seeking protection from volatility. Gareth still sees the possibility of a pullback toward the $3,500 area, however, and the metal's recent resilience does not rule out additional downside.
Silver has also been reacting to important technical levels. Following a move through the $50 area, Gareth identified the possibility of a further pullback toward $45. He continues to view the longer-term backdrop favorably, particularly given concerns about government debt, monetary expansion, and the purchasing power of fiat currencies. Those factors form part of his broader thesis for holding physical precious metals over time.
Gareth also addressed the popular de-dollarization argument. Although changes in global reserve preferences and confidence in currencies can influence demand for precious metals, the transition away from an established reserve currency is typically a lengthy process. His preference is to avoid treating dramatic predictions about the dollar as immediate trading signals. The charts provide a more practical framework for identifying potential entries and assessing near-term price behavior.
For gold and silver, the distinction between a long-term accumulation thesis and a shorter-term trading setup remains important. Gareth can maintain a constructive view of physical precious metals while still recognizing that prices may decline before reaching more attractive technical levels.
Oil Price Outlook: $95 Resistance Keeps the Bearish Structure Intact
Oil continues to follow a technical structure Gareth has been monitoring. After breaking below a wedge formation, prices have moved higher toward the area where the breakdown originally occurred. Gareth frequently refers to this type of move as a return to the "scene of the crime," where a market retests a former support level that may now act as resistance.
The level he is watching is approximately $95. As long as oil remains below that resistance area, the chart continues to favor the possibility of renewed selling following the retest. A sustained move above resistance would weaken the bearish interpretation and suggest that the breakdown may be losing its influence.
This type of retest can be useful because it provides a defined area for evaluating whether sellers remain in control. Rather than responding to every movement in crude oil, Gareth is using the structure of the prior breakdown to determine where the next meaningful reaction may occur.
Natural gas remains less decisive. Gareth described a broad trading range between approximately $2.45 and $3.15, with a descending trendline continuing to limit upside progress. Until price can break and hold above that trendline, the chart offers limited evidence of a sustained bullish shift. The range may continue to produce shorter-term opportunities, but a larger directional move still requires confirmation.
Bitcoin Price Analysis: Relative Weakness Raises Downside Risk
Bitcoin was one of the more concerning charts in Gareth's November 6 analysis. While technology stocks and semiconductor names were attempting to recover from the previous session's selling, Bitcoin was showing comparatively little strength. That divergence caught Gareth's attention because Bitcoin has frequently traded with characteristics similar to other high-volatility risk assets.
When equities rebound sharply and Bitcoin struggles to participate, the difference can indicate that buying interest is weaker in the cryptocurrency market. Gareth views that relative weakness as a warning, particularly if Bitcoin begins breaking important support while other risk-sensitive assets stabilize. It does not guarantee another decline, but it suggests that the technical picture deserves additional scrutiny.
The original analysis references a support area described as "175.5 and 175," followed by a potential downside support level near $67,000. Because the first two figures are ambiguous, the precise support zone needs to be confirmed against Gareth's chart before publication. The underlying technical framework is clear: a break of the support he identified would weaken Bitcoin's near-term structure and could expose a larger downside move toward the next major support area.
For Bitcoin, the key question is whether buyers can begin defending support and restore some of the relative strength that has been missing during the equity rebound. Until that occurs, Gareth's analysis suggests that downside risk remains elevated, even if other parts of the market are recovering.
Gareth Soloway's Trading Strategy: Buy at Support and Manage the Bounce
The broader lesson from today's Game Plan is that market panic can create opportunities for traders who have already identified where they want to act. Gareth is willing to consider buying stocks that have suffered substantial declines when the charts show meaningful support and the fundamental backdrop remains reasonable. His approach does not require predicting the exact market bottom.
That becomes especially important during violent rebounds. Stocks that have fallen sharply can recover quickly as short sellers cover positions and buyers return. Those moves can create attractive gains, but they can also reverse if the broader downtrend resumes. Gareth emphasized the importance of taking partial profits when a trade moves favorably, particularly after a strong bounce from support.
As he explained:
"It's not always about how much you make on the trade, but when you have cash, if you take profits, it frees up that capital to be used again, and people forget about that opportunity cost."
Taking partial profits serves two purposes. It reduces exposure after a favorable move and makes capital available for future setups. In a volatile market, that flexibility can be valuable because another sell-off may create a better entry, even in stocks that have already produced profitable trades.
Bottom Line: The AI Sell-Off Has Created Setups, but Confirmation Still Matters
Gareth's November 6 Game Plan centers on a market where fear has pushed several technology stocks toward meaningful technical support. Nvidia's $178 to $181 area, Marvell's $128 to $130 zone, and deeper support levels across earnings-driven stocks provide specific areas to evaluate. At the same time, gold's changing relationship with equities, oil's retest of resistance, and Bitcoin's relative weakness offer additional information about where capital may be moving.
The opportunity is in recognizing when selling has become extended enough to create favorable trading conditions, while accepting that a bounce and a lasting bottom are two different outcomes. Gareth's framework is to identify the support, evaluate the business and market backdrop, and manage exposure as price reacts. In a market driven by sharp swings in sentiment, preserving capital and maintaining the flexibility to act on the next setup remain central to the Game Plan.
Educational and informational purposes only. This article summarizes market analysis and trading scenarios discussed by Gareth Soloway. It is not personalized investment advice or a recommendation to buy or sell any security. Trading and investing involve risk, including potential loss of principal. Technical levels and market conditions can change.
Trading involves substantial risk. All content is for educational purposes only and should not be considered financial advice or recommendations to buy or sell any asset. Read full terms of service.