My Trading Game Plan Revealed - 11/11/2026: Veterans Day Rally Sparks Retail Led Upside Nvidia Rebound and AI Surge

S&P 500 Rally Tests Failed Breakdown as Gareth Soloway Eyes Nvidia, Nasdaq Support
The S&P 500 and Nasdaq were pointing higher ahead of Wednesday's opening bell, but Gareth Soloway sees a more important technical story developing beneath the rally. The recent market selloff failed to produce a confirmed breakdown, and several major charts have responded from areas of technical support. On the November 11 edition of My Trading Game Plan, the Verified Investing Chief Market Strategist explained why that failed confirmation matters, how the Veterans Day bond market closure may affect trading conditions, and where he sees opportunities in Nvidia and other heavily sold technology stocks.
The central question is whether buyers can build on the recent recovery as normal bond market activity resumes. Gareth's framework combines trendline confirmation, the number of times support has been tested, and the broader macro environment. Those factors help determine whether a rally has room to continue or whether traders should prepare for another test of support.
Veterans Day Bond Market Closure Could Influence Stock Market Trading
Wednesday's Veterans Day holiday creates an unusual trading environment. The U.S. bond market is closed while equity markets remain open, temporarily removing one of the major sources of intraday movement in interest rates. Gareth explained that these sessions can develop a neutral-to-positive bias because participation may shift toward retail traders, who generally approach the market from the long side.
In Gareth's experience, that change in participation can allow equities to drift higher when there is limited institutional selling pressure. However, the relationship is a trading observation rather than a guarantee. Institutional equity traders and automated strategies can remain active during bond market holidays, and other catalysts can still move prices. The more useful takeaway is that Wednesday's price action may develop under different liquidity conditions than a typical trading session.
That becomes particularly relevant with the 10-year Treasury yield near the psychologically important 5% area discussed during the show. When the bond market reopens, renewed yield movement could influence equity valuations and risk appetite. Gareth is watching whether the technical recovery can hold once those additional market pressures return.
S&P 500 Technical Analysis: Why the Breakdown Failed to Confirm
One of Gareth's most important observations came from the S&P 500 chart. Earlier in the week, the index closed below a significant ascending trendline, creating what initially appeared to be a bearish breakdown. However, under Gareth's confirmation methodology, that first close was insufficient to establish a sustained move lower.
His framework required a second daily close below the low of the breakdown candle. That follow-through never arrived. Instead, the market held above the relevant low and subsequently recovered, leaving the original bearish signal unconfirmed. The distinction is important because traders who act on the initial break can find themselves positioned against a market that has not established sustained downside momentum.
Gareth also discussed how institutional traders can take advantage of crowded positioning around obvious technical levels. A break below support may encourage long holders to exit and short sellers to enter, creating conditions for a sharp reversal if selling fails to continue. That does not establish institutional intent in any particular move, but it helps explain why confirmation is central to his approach.
The S&P 500's subsequent recovery and successful test of the trendline strengthened the near-term technical picture. With futures indicating a gain of roughly 1% ahead of Wednesday's open, the immediate focus shifts to whether buyers can sustain the move. A renewed breakdown with a confirming daily close would weaken the recovery thesis, while continued support above the reclaimed area would favor additional upside.
Nasdaq 100 and QQQ: Why Repeated Trendline Tests Matter
The Nasdaq 100 presented another example of Gareth's approach to technical probabilities. During the broadcast, the QQQ ETF was trading around $687 in the premarket, up more than 1%. The recent rebound followed a test of an ascending trendline connected to important market lows, including the April 2025 selloff associated with tariff concerns.
Gareth emphasized that the number of times a trendline has been tested can change how traders evaluate the next interaction. The first significant low establishes a reference point, while a second touch helps define the line. By the third test, traders have a more established technical structure to evaluate, although each additional return to support may change the risk profile.
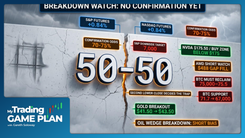
Under Gareth's trading framework, a third touch of a well-established trendline has historically represented a higher-probability bounce setup. He estimated the odds at approximately 75% to 80% for the particular structure discussed during the show. Those figures reflect his trading assessment and should not be interpreted as independently verified statistical probabilities.
The concern develops with repeated tests. Gareth views a fourth interaction as closer to an even probability of holding or breaking, with a fifth test potentially carrying greater breakdown risk. Repeated selling into the same support area can absorb available demand, leaving fewer buyers willing to defend the level.
For QQQ, the initial rebound has already occurred. Gareth's framework now calls for watching how the ETF behaves if it returns to the ascending trendline. A fresh test would carry a different risk profile than the earlier bounce, making price confirmation increasingly important before establishing a new position.
Nvidia Stock: Three Technical Factors Support Gareth's Swing Trade
Nvidia was among the most important individual stocks discussed during Wednesday's Game Plan. Following a sharp decline over the preceding month, Gareth identified a convergence of three technical factors that supported his decision to establish a position during Tuesday's session.
The first factor was a previous pivot low aligning with a gap-fill area. The second was a descending trendline connecting important highs on the chart. The third came from a parallel trendline projected from the upper price structure toward the April 2025 low. According to Gareth's analysis, all three factors converged within the same general price zone.
That combination is central to his technical thesis. When several independently identified chart structures point toward a similar area, the setup becomes more compelling within his trading methodology. It does not eliminate downside risk or establish a measurable probability of success, but it provides a clearer basis for evaluating an entry and determining whether the original setup remains valid.
Gareth also discussed Nvidia's valuation following the selloff. He argued that the decline had made the stock more attractive relative to its longer-term growth prospects. However, valuation depends on the earnings estimates and assumptions used, and a lower forward earnings multiple alone does not establish that a stock is undervalued.
For this position, Gareth identified the $185 to $190 area as a potential profit-taking zone. His approach is based on a swing trade rather than an assumption that Nvidia has completed its broader correction. The next consideration is whether price can maintain the technical structure that supported the entry. A decisive loss of that support would require reassessing the setup.
CoreWeave Earnings and AI Stocks: A Rally With Short-Squeeze Risk
CoreWeave was another notable technology name on Gareth's radar following its earnings release. Shares were indicated more than 10% higher in the premarket after a period of substantial weakness, bringing attention back to the market's assessment of AI infrastructure spending and financing risks.
Gareth identified approximately $60.50 as an important gap-fill resistance area. That level could attract sellers if the stock rallies into it, but he cautioned against treating the setup as an extended short position. A heavily sold stock responding positively to earnings can produce aggressive upside moves, particularly when short sellers begin covering positions.
For traders considering the resistance level, Gareth's framework favors a short-duration setup with active risk management rather than a longer-term bearish commitment. A sustained move through $60.50 would weaken the immediate resistance thesis, while rejection from that area could create an opportunity for a short-term pullback.
Elsewhere in the market, Gareth discussed Sandisk's technical rebound and Fossil's earnings-related price movement, identifying $11.15 as an area of interest on Fossil's chart. JPMorgan also remained on his watchlist, with approximately $327 representing an important support reference. A confirmed break below that area would weaken the bank's existing ascending trendline structure.
Treasury Yields, Inflation and the U.S. Dollar Remain Equity Market Risks
The technical rebound in equities is developing alongside a macroeconomic backdrop that Gareth continues to monitor. He highlighted strength in the U.S. dollar following the inflation data discussed during the show, with the dollar approaching a potential double-top formation on the daily chart.
The dollar's movement matters because sustained strength can affect financial conditions, commodity prices, and risk appetite. Gareth also focused on the 10-year Treasury yield near 5%, an area that carries both psychological and valuation significance for investors.
Higher Treasury yields can make fixed-income investments more competitive with equities while increasing the discount rates applied to future corporate earnings. That pressure can be particularly relevant for growth-oriented technology stocks, where valuations often depend heavily on expectations for earnings well into the future.
The bond market's closure provides a temporary pause in Treasury trading, but it does not resolve the underlying inflation and interest-rate questions. Gareth's next macro watchpoint is how yields and the dollar behave when regular bond trading resumes. A renewed move higher in yields could challenge the equity rebound, even if the technical charts remain constructive in the near term.
Oil, Natural Gas, Gold and Silver: Different Technical Signals
Outside equities, Gareth reviewed several commodity charts showing different stages of their respective trends. Crude oil was attempting a modest recovery after becoming technically oversold, but the broader chart remained weak in his assessment. He identified the $95 to $96 area as significant overhead resistance and continued to favor the possibility of lower prices unless oil could repair its technical structure.
Natural gas presented a different situation after seven consecutive advancing sessions. Gareth discussed having taken profits during the prior session and was evaluating the possibility of a short-term bearish setup following the extended move. At the same time, his broader analysis allowed for a potential upside breakout after an appropriate period of consolidation. The timing and structure of the next pullback would help determine which opportunity becomes actionable.
In precious metals, silver was showing relative strength compared with gold. Gareth identified a possible bull flag in silver, while gold remained comparatively soft. One potential explanation is silver's additional exposure to industrial demand, including electronics and infrastructure applications, although the relationship between AI investment and short-term silver prices is not necessarily direct.
The divergence gives traders another way to evaluate market positioning. Silver's ability to maintain its constructive chart structure while gold struggles could indicate different demand dynamics across the metals complex. Gareth's emphasis remained on whether the respective charts confirm those possibilities.
Bitcoin Price Analysis: $71,700 Emerges as Key Support
Bitcoin was another area of concern because it was failing to participate meaningfully in the equity market rebound. Gareth highlighted that relative weakness as a potential sign that cryptocurrency investors remained less willing to take risk despite the recovery in technology shares.
His next major downside reference was approximately $71,700, a technical support area identified on the Bitcoin chart. That level provides a defined point for evaluating whether selling pressure begins to ease or whether the market continues toward lower support.
Gareth also discussed the possibility of capital rotating away from cryptocurrency and toward AI-related equities. That remains a market interpretation rather than a confirmed measure of investor flows. The observable signal is Bitcoin's relative weakness, particularly if technology stocks continue advancing while Bitcoin struggles to recover.
For traders, the $71,700 area is the immediate technical reference. A successful test could establish a potential rebound setup, while a confirmed break below support would suggest that the current downside structure remains in control.
Gareth Soloway's Market Outlook: Confirmation Comes Before Conviction
Wednesday's market setup brings several important technical and macro signals together. The S&P 500 avoided confirming a bearish breakdown, the Nasdaq rebounded from established trendline support, and Nvidia reached an area where three technical factors converged. Those developments have improved the near-term trading picture, but the next phase depends on whether buyers can maintain the recovered levels.
Gareth's approach remains grounded in probability, confirmation, and risk management. A trendline break requires follow-through, repeated support tests can change the odds of a bounce, and even a strong technical setup needs a defined point at which the original thesis no longer holds. These principles are especially relevant when a sharp rebound follows a period of heavy selling.
The next important test comes as the bond market reopens and Treasury yields return to active trading. If equities maintain support while yields stabilize, the recovery could develop further. If yields resume climbing and major indexes lose their reclaimed technical levels, the bullish interpretation would weaken.
The immediate game plan is clear: watch the S&P 500's reclaimed trendline, evaluate any renewed QQQ support test, follow Nvidia's progression toward the $185 to $190 objective, and keep the 10-year Treasury yield in focus. Those reference points will help determine whether the current rebound is gaining technical strength or approaching another important decision area.
My Trading Game Plan with Gareth Soloway airs weekdays at 9:00 AM ET on Verified Investing.
This article is for educational and informational purposes only and does not constitute financial advice. Trading and investing involve risk, including the potential loss of principal. Market analysis reflects the views discussed during the November 11, 2026 broadcast and is not a guarantee of future performance.
Trading involves substantial risk. All content is for educational purposes only and should not be considered financial advice or recommendations to buy or sell any asset. Read full terms of service.