Trading The Close Market Recap - 06/03/2026: Markets Pull Back on Strong Jobs — 'Higher for Longer' Rates Hit Tech & Crypto

The financial markets took a noticeable breather today, digesting a confluence of robust labor data and shifting macroeconomic expectations. As the S&P 500, the Nasdaq Composite, and the Russell 2000 all experienced selling pressure, traders are being forced to recalibrate their expectations for Federal Reserve policy. In today’s Trading The Close Market Recap show, Pro Trader Drew Dosek at Verified Investing broke down the critical technical levels, the shifting interest rate landscape, and the post-earnings price action of major tech giants.
This environment—characterized by overextended equities, rising yields, and shifting monetary policy probabilities—requires a disciplined, multi-factor approach to technical analysis.
The Macro Shift: Labor Data and the Rate Hike Reality
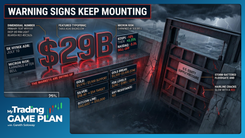
The most significant catalyst for today’s market action was the release of the ADP job report, which came in slightly better than anticipated. This data point followed earlier JOLTS (Job Openings and Labor Turnover Survey) data that revealed a remarkably robust labor market, boasting enough job openings to theoretically cover every unemployed person in the United States.
While a strong labor market is traditionally viewed as a positive economic indicator, in the current macroeconomic environment, it presents a massive headwind for equities. Strong employment data fuels inflation concerns, which directly impacts Federal Reserve policy.
As Pro Trader Drew highlighted, the market narrative has shifted sharply: “We entered this year looking for rate cuts. Now we’re talking about rate hikes, and they’re likely going to be coming at the end of this year, at least according to the Fed CME data prediction tool.”
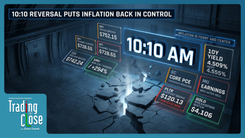
According to the rate-probability tool Drew referenced during the show, markets were pushing expectations for the next potential cut much farther out, with December 2027 appearing on the radar. This “higher for longer” reality is already being reflected in the bond market. The 10-year Treasury yield pushed up to 4.491%, threatening to close above its March pivot high. If it confirms this breakout, the next technical target is a declining trend line at 4.562%.
Rising yields disproportionately impact growth sectors, particularly the massive capital expenditures required for building out new AI data centers. When the cost of borrowing remains elevated, the present value of future corporate earnings decreases, putting natural downward pressure on high-multiple tech stocks.
Equity Indices at a Technical Crossroads
Against this macroeconomic backdrop, the major indices are showing signs of technical exhaustion.
The S&P 500 has been riding an inclining trend line for several days. After finally breaking above it, the index has curled back over to retest the line. From a technical perspective, the index is heavily extended. The daily RSI (Relative Strength Index) is hovering around the 70 level, a classic overbought signal indicating that the market needs to consolidate or pull back. If the selling pressure continues, the next major area of support sits at $732 on the Spiders (SPY).
The Nasdaq Composite (IXIC) also finished down 0.89%, though it has not yet tagged its own inclining trend line. For traders looking for short-term opportunities, intraday support sits at 26,690 points. A pierce of this level could provide a one-to-two-day bounce, relieving some of the pressure from its recent seven-day upward push.
The SMH Divergence and the Hangman Candle
Perhaps the most fascinating technical setup among the indices is in the semiconductor sector. While the broader markets sold off, the SMH ETF managed to close up 0.9%. However, price action tells a deeper story than the daily percentage gain.
The SMH formed a classic "hangman candle" today. In technical analysis, a hangman forms at the top of an uptrend and is characterized by a small real body and a long lower shadow. It indicates that sellers stepped in significantly during the session, even though buyers managed to push the price back up by the close.
While not entirely bearish on its own, it is a severe warning sign. As Drew explained: "This is a hangman candle, and if you want to see if you're a bear or want to see any sort of selling in the SMH, you want to see tomorrow put in a daily close underneath this candle." A daily close below today's low of $623.91 would confirm the reversal, potentially sending the SMH down to test its inclining trend line support dating back to the end of March.
Meanwhile, the small-cap IWM continues to chop sideways, pressured by the rising 10-year yield. It remains trapped in a consolidation pattern, with downside support at $280.33 and upside resistance at the top of its bull flag channel at $297.24.
Commodity Confluence: The Dollar, Metals, and Oil
The robust labor data and shifting rate expectations also sent ripples through the currency and commodity markets. The US Dollar Index (DXY) pushed higher, forming a textbook bull flag pattern that implies a measured move upward. The next technical target for the DXY is a break above the century mark to $100.76.
A rising dollar and the threat of higher rates create pressure for precious metals. Gold faced significant downward pressure, breaking beneath near-term support to trade sub-$4,450. Because gold has been consolidating on top of a parallel breach for many days, technical probabilities suggest it will slice through current levels to find more serious support at $4,189. Silver suffered a similar fate, dropping 2.84%. While a near-term bounce could occur at $71.55, the more significant macro level is the March low pivot at $61.00.
The Power of the Topping Tail in US Oil
US Oil pushed up roughly 3% today, adding further inflationary pressure to the macroeconomic picture. However, the chart of US Oil offers a sharp reminder of the predictive power of technical analysis.
Back on March 9th, oil put in a massive daily topping tail. Months later, that single candle continues to dictate price action. "Has price ever gotten above it since? No, it has not," Drew noted. "So we're talking about several months of foreshadowing that this one candle provided. Guys, that's the power of technical analysis."
Currently, oil is approaching resistance at a declining trend line connecting recent pivot tops, sitting right around $101.17. Unless geopolitical conflicts escalate dramatically, this trend line should serve as formidable resistance.
In the energy sector, Natural Gas also saw a 2% bounce, catching support from the wicks of previous daily candles. For bulls to maintain control, natural gas needs to hold above the $3.32 level to build momentum for a breakout.
Crypto and High-Flyers: The Psychology of Extremes
The cryptocurrency market and individual high-flying tech stocks provided excellent examples of how to trade both overbought and oversold extremes.
Bitcoin suffered a nasty sell-off, confirming a breakdown from a bear flag pattern. However, the daily RSI has plummeted to 20.23, indicating deeply oversold conditions in the near term. Technical analysis dictates that when an asset breaks a key support trend line and becomes this oversold, it often bounces back to retest the scene of the crime.
For Bitcoin, high-probability support sits at the bottom of its parallel channel between $62,681 and $62,500. From there, an optimistic bounce could carry the price back up to retest the broken trend line at $71,850 before the broader downtrend resumes.
Profit-Taking in Overextended Equities
On the opposite end of the spectrum, several stocks are flashing warning signs of being severely overbought. IBM, which has ripped 56% since May 13th, closed above support at 304.11 but began dropping in after-hours trading. Rapid, parabolic moves are highly vulnerable to aggressive profit-taking. If IBM breaks down, the next logical support is the bottom of its parallel channel at $287.26, with deeper historical support residing at $225.00.
Datadog (DDOG) is painting a similarly cautionary picture, forming a nasty weekly topping tail. While the week isn't over, the mid-week formation suggests momentum is waning. Support levels sit at $214.49 (the top of a parallel channel) and a declining trend line at $202.17.
Conversely, stocks like Rivian (RIVN) and SanDisk (SNDK) are testing critical upside breakouts. Rivian pushed up 5.67%, breaking through the 50% area of its parallel channel. However, it is approaching a longer-term inclining trend line resistance at $18.58, with secondary resistance at $20.54. Because the stock is near-term overbought, a pullback to the breakout trend line sub-$16.00 would trigger a high-probability buy signal.
SanDisk managed a single daily close above its inclining trend line, acting as a "test candle." If bullish momentum continues, it faces immediate resistance at the top of its parallel channel near $1,900.
Earnings After the Bell: Priced for Perfection
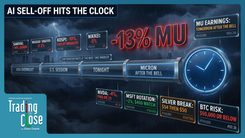
Earnings season always provides a stark reminder of how market expectations dictate price action. After the closing bell, both CrowdStrike (CRWD) and Broadcom (AVGO) reported earnings, and both experienced severe immediate sell-offs despite their dominant market positions.
CrowdStrike has been on an absolute tear, driven by the narrative that the AI revolution will require massive cybersecurity upgrades to combat next-generation hacking threats. The stock marched from $475 to $785 with virtually zero red daily candles. However, priced for absolute perfection, the stock slammed down to $677.18 after hours.
The technical damage requires patience from traders. The next high-probability support zone sits between $650 and $640.90, where a parallel channel and an inclining trend line from July 2025 converge. If that multi-factor support fails, the next floor is down at $606.37.
Broadcom (AVGO) suffered a similar fate. The stock entered its previous earnings call around $310 and rocketed into today's earnings call at $495. When a stock makes an almost 60% move between quarterly reports, the mathematical edge heavily favors the downside.
"Whenever you have a stock that's going from an earnings call over here where price was around $310. And then now we're into the next earnings call just this quarter… The probabilities for continued upside after an incredible move like this are so slim," Drew explained.
After dropping roughly 8% to the $440 range in after-hours trading, AVGO is testing the top of its previous consolidation zone. If selling continues tomorrow, traders should watch the gap fill at $426.58, followed by the critical 50% parallel support at 412.93. A failure to hold that 412.93 level would represent a significant technical breakdown for the semiconductor giant.
Conclusion: The Value of Education and Discipline
Today's market action perfectly encapsulates why trading based on emotion, headlines, or permanent biases is a recipe for disaster. The macroeconomic data is shifting, forcing a repricing of interest rate expectations that ripples through bonds, currencies, commodities, and equities.
Navigating this environment requires a strict adherence to technical levels, an understanding of probabilities, and the discipline to wait for the right setups. Whether it’s waiting for Bitcoin to hit oversold support at $62,500, watching for SMH to confirm its hangman candle, or patiently letting CrowdStrike fall to its $650 support zone, disciplined trading is about execution, not anticipation.
That is also why foundational trading education matters. Drew’s new course for beginner and intermediate traders focuses on the structural mistakes that often cause the largest losses: account setup, risk management, and emotional control. By learning from the expensive mistakes of seasoned professionals, retail traders can protect their capital and approach the charts with a logic-based, probability-driven mindset.
As the market continues to digest this new "higher for longer" reality, the charts will provide the roadmap. Stay disciplined, respect the technicals, and let the probabilities work in your favor.
Trading involves substantial risk. All content is for educational purposes only and should not be considered financial advice or recommendations to buy or sell any asset. Read full terms of service.