Trading The Close Market Recap - 06/24/2026: 11th-Hour Semiconductor Reprieve, PCE Data & Micron Volatility

The Market Got Saved Into the Close, But Semiconductors Still Hold the Key
The headline from today’s session was not the small move in the major indexes. It was the save into the close.
For most of the day, the market was under pressure as traders reduced risk ahead of two major catalysts: core PCE tomorrow morning and Micron earnings after the close. The selling pressure was especially important in semiconductors, where SMH was close to confirming a breakdown below the prior session’s low.
Then, in the final seconds of trading, that confirmation was taken away.
On today’s Trading the Close Market Recap, Verified Investing Pro Trader Drew Dosek focused on that late semiconductor reversal because it changed the read. It did not make the market bullish. It did not clear the risk. But it did keep the current semiconductor structure alive for at least one more session.
That is the key takeaway. The market did not erase the warning signs today. It only avoided confirming them.
Semiconductors Avoided the Breakdown
The most important chart into the close was SMH.
Throughout the session, semiconductors were trading like a sector on the edge of a confirmed technical break. A daily close below the June 23rd low would have shifted the structure lower and likely pressured the broader market with it. Instead, buyers stepped in right before the bell.
As Drew put it, SMH ripped higher about 10 seconds before the close, negating the confirmation that would have broken the current trend.
That matters because semiconductors continue to lead the market’s risk appetite. Tech leads the indexes, and semiconductors lead tech. When that group holds, the broader market can absorb a lot of pressure. When that group fails, the rest of the tape usually becomes harder to trust.
The issue is that the save came at the last possible moment. That makes the level more important, not less. The June 23rd low remains the line in the sand. A daily close below that pivot confirms the breakdown Drew was watching. Until that happens, the market has not given full bearish confirmation, but the warning remains active.
The candle structure is also part of the concern. SMH recently printed another hanging man type candle after an extended move. The last similar setup on June 3rd was followed by a sharp decline. The June 22nd candle has already led to meaningful weakness. That does not guarantee another leg lower, but it tells traders the sector is no longer moving cleanly higher.
The close bought the bulls time. It did not remove the pressure.
SPY and QQQ Are Still Dealing With Resistance
The major indexes reflected the same tension.
SPY finished the regular session nearly flat, down 0.05%, while after-hours trading improved the tone. The problem is that the chart is still dealing with an inclining trendline that has started to act as resistance. Price recently gapped down through that line, and the highs from the last two sessions have been rejected near it.
For SPY, the level Drew is watching is $740. A move above that area would help clear near-term resistance and shift the read back toward upside continuation. Until then, the market is still trading beneath a level it recently lost.
If SPY cannot reclaim that resistance, the next support area to watch sits near $729, around the top end of the prior parallel channel. That is where the market would begin testing whether the recent move is consolidation or the start of a deeper reset.
QQQ was weaker during the regular session, closing down 0.42%. It still has not tagged the underlying support level at $703.09, but if the after-hours strength carries into tomorrow, the upside level to watch becomes the gap fill and resistance zone near $737.95 to $738.43.
That zone matters because gap fills can pull price in, but they can also become rejection areas once tested. If QQQ pushes into that level after PCE, Drew will be watching whether buyers can sustain momentum through it or whether the market stalls at the first major supply zone overhead.
PCE and Micron Are the Immediate Catalysts
The timing of today’s weakness was not random.
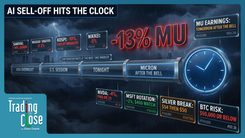
Traders were reducing exposure ahead of core PCE at 8:30 AM ET tomorrow and Micron earnings after the close. Those are two very different catalysts, but both feed directly into the same market question: can the AI and semiconductor trade continue holding up while macro uncertainty remains elevated?
A hotter inflation print could revive pressure on rate expectations and keep yields and the dollar firm. A cooler print could ease that pressure and give equities room to bounce. Micron matters because memory has been one of the key areas tied to AI infrastructure demand. If MU confirms strength, it can support the semiconductor trade. If it disappoints, the weakness in SMH becomes harder to ignore.
That is why today’s late save matters so much. The market is heading into tomorrow with the structure still technically alive, but fragile.
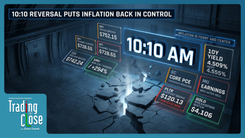
The Failed Move in Yields Was One of the Cleanest Reads
Away from equities, one of the clearest technical signals came from the 10-year Treasury yield.
Earlier this week, the 10-year yield appeared to be building above the 4.484% resistance area. The lower wicks on the prior candles suggested buyers were still stepping in and that yields may have been preparing for another push higher.
Instead, the move failed.
The 10-year yield rejected hard and undercut the recent consolidation. Drew highlighted the key lesson from that price action: failed moves often generate some of the sharpest moves in the opposite direction.
That is the trader read. When a market breaks above resistance and then cannot hold it, the breakout buyers are trapped. As those positions unwind, price can move quickly back the other way.
For the 10-year yield, the next important support level sits near 4.363%. A continued move lower in yields could help equities, especially growth and tech, but that relationship depends heavily on tomorrow’s inflation data. If PCE changes the bond market’s read, the equity setup changes with it.
The Dollar Breakout Is Still a Headwind
The US Dollar Index pushed higher again, up 0.19%, extending its breakout from an inclining parallel channel. The next major resistance level Drew is watching sits at 101.97.
If DXY rejects there, the natural back-test level is the top of the former channel near 100.79. If it holds that area, the breakout remains intact. If it loses that level, the move weakens.
For risk assets and commodities, the dollar matters because strength in DXY often tightens the pressure on metals, energy, and parts of the equity market. That showed up clearly today.
Gold dropped under $4,000, with daily RSI slipping below 30. That puts gold into oversold territory on a near-term basis, but oversold is not the same thing as support. The next major level below sits near $3,886. A tag of that area could create a bounce attempt back toward the broken parallel channel, but buyers still need to prove they can reclaim structure.
Silver was hit harder, falling 6.5% and trading as low as roughly $55.62 intraday. The next support zone Drew is watching sits near $55.09. Late in the day, silver printed a 10-minute bottoming tail, which opens the door for a bounce toward the 50% area of the parallel channel near $58.59. That level is the near-term test. A rejection there keeps the downside pressure in control.
Oil also remained under pressure, trading below $70 with daily RSI at 25.85. The chart is stretched, and price is sitting on a major support area tied to a declining weekly trendline. First resistance on a bounce sits near $75.56. If support breaks, the next major downside level is $62.33. Drew also noted the $67.22 consolidation area as a place where buyers may try to stabilize the move.
Natural gas is dealing with a cleaner technical flip. After closing below its inclining trendline for two straight sessions, that former support has become resistance. The $3.33 area is the rejection level to watch, with downside support near $3.03.
Bitcoin Still Has a Larger Structural Problem
Bitcoin also stayed under pressure, trading below its inclining parallel channel and revisiting lows last seen around June 5th.
The near-term RSI has moved back above 30, which reduces immediate oversold pressure, but the bigger chart remains the issue. On the weekly timeframe, Bitcoin is still tracing a large head and shoulders pattern. If that structure confirms, the measured move points below $40,000, with Drew’s projection near $37,508.
That does not mean Bitcoin has to move there in a straight line. Drew’s focus is on where a bounce could form if the selling accelerates.
The key concept is the “Sleeper Hold.” When price consolidates, breaks out, and later returns to the original consolidation zone, that area often acts as meaningful support. For Bitcoin, that zone sits near $53,000.
If Bitcoin loses the June 5th lows and drops quickly, $53,000 becomes the area where Drew would expect buyers to attempt a stronger reaction. A bounce from there could eventually push price back toward the lower boundary of the prior parallel channel near $64,884. But until Bitcoin reclaims structure, the broader weekly pattern remains the bigger risk.
Micron’s Late-Day Surge Was the Single-Stock Story
Micron was one of the most important individual charts of the day because of what happened before earnings were officially released.
At 3:10 PM, while MU was trading near intraday lows and sitting in the lower half of its parallel channel, a sudden wave of buying volume hit the stock. That move pushed MU back above the 50% area of the channel before the after-hours earnings release.
Drew’s point was not that traders need to prove exactly why that move happened in real time. His point was that event-driven names can behave in ways that are difficult for retail traders to compete with. When major volume hits ahead of public news, the cleanest response is not to guess. It is to respect the technical levels and avoid assuming the market is a level playing field around major catalysts.
After the surge, MU still faces resistance. The double-top area and parallel channel resistance sit slightly above $1,230. That is the zone where the reaction becomes meaningful. If MU clears it, the semiconductor trade gets a stronger tailwind. If it rejects, the late-day move starts looking more like a save than a true breakout.
Other single-stock charts showed similar exhaustion signals. SNDK moved back above $2,000 after catching support on a clean hourly trendline, but it still produced a daily topping tail. Resistance now sits near $2,184. STX also printed a topping tail and faces major resistance near $1,153, the top of a parallel channel it has already tested multiple times. NBIS remains a larger head and shoulders watch, with key support tied to a long-term rising trendline from February 2025.
The common thread is simple: strength exists, but the charts are starting to ask for confirmation.
Uber and the One-Candle Rule
The Uber chart gave Drew a chance to reinforce one of the most important trading lessons from the show: one candle is not enough.
Uber is forming a potential weekly head and shoulders pattern, with the neckline near $70.75 this week and $70.87 next week. A confirmed break of that neckline would point to a much lower measured move, potentially below $35. Near-term resistance sits at $76.32.
But Uber recently closed below the neckline for only one day before popping back above it. That is not enough confirmation.
Drew’s framework is clear. The first candle through a major level is a test. The second candle is where confirmation starts to matter. Traders who react immediately to the first break can get trapped in false breakdowns. Waiting for follow-through may cost a small amount of the move, but it gives a much cleaner read on whether support has actually flipped into resistance.
That lesson applies beyond Uber. It applies to SMH, Bitcoin, yields, metals, and every major chart heading into tomorrow.
Bottom Line
Today’s market did not deliver a clean bullish reversal or a clean bearish breakdown. It delivered a save.
SMH avoided confirming a breakdown in the final seconds of the session, and that kept the broader market structure alive into tomorrow. But the pressure remains. PCE can reset the macro read. Micron can reset the semiconductor read. The 10-year yield has already produced a failed breakout. The dollar is still firm. Metals and oil are stretched but weak. Bitcoin still has a larger weekly pattern hanging over it.
The market gave traders a roadmap, not a resolution.
For tomorrow, the levels are clear: SMH must hold the June 23rd low, SPY needs to reclaim $740, QQQ faces resistance near $737.95 to $738.43, the 10-year yield has support near 4.363%, and the dollar has resistance at 101.97. Until those levels resolve, the right approach is patience, confirmation, and respect for the close.
The final seconds saved the tape today. Tomorrow tells us whether that save actually mattered.
Trading involves substantial risk. All content is for educational purposes only and should not be considered financial advice or recommendations to buy or sell any asset. Read full terms of service.