Trading The Close Market Recap - 07/21/2026: Light-Volume Rally: Short-Covering Bull Trap Risk Ahead of Tech Earnings

Stocks Rallied Into the Close, but Volume Did Not Confirm the Move
Stocks finished higher today, but the more important signal was what did not accompany the rally: meaningful volume.
The S&P 500 and Nasdaq 100 recovered key technical ground, while several bearish semiconductor patterns were temporarily negated by gap-ups above their necklines. On the surface, that looked like a bullish shift. Underneath the move, however, participation remained light as Treasury yields and oil prices continued higher.
Drew Dosek’s central takeaway on today’s Trading the Close was that price improved, but conviction did not. The rally may have been driven more by short covering than by institutions building fresh long exposure. That leaves the market stronger technically than it was yesterday, but still short of the confirmation needed to trust the move.
A Bullish Recovery Without Bullish Participation
The S&P 500 entered the session beneath the wedge structure that had separated bullish price action above from bearish price action below. After bouncing from the 742 area overnight, the index pushed back toward 750 and recovered much of the recent breakdown.
The Nasdaq 100 ETF, QQQ, also regained an important lower support area and moved back into the range of the prior breakdown candle. The next technical test sits near the $717.74 gap fill, where a declining trendline adds resistance.
Those recoveries matter, but volume changes how they should be interpreted.
The S&P 500 traded roughly 29 million shares, a light figure for a session that appeared to reverse several bearish developments. Low participation does not invalidate the rally, but it raises the probability that forced buying played a larger role than fresh accumulation.
That distinction is especially important after a gap above resistance. Traders positioned short are forced to buy back shares as price moves against them. Their exits can lift the market quickly, even when larger buyers are not aggressively stepping in.
The result is a rally that improves the chart without fully confirming the change in character.
Semiconductors Delivered the Clearest Example
The semiconductor sector showed the same dynamic through the VanEck Semiconductor ETF, SMH, and major memory names including Western Digital, Micron, and SanDisk.
Several of those charts entered the session with developing head and shoulders patterns. SMH then opened above its neckline, immediately weakening the bearish setup and pressuring traders who had positioned for a breakdown.
The move was technically meaningful, but participation again remained limited. SMH traded approximately 6.92 million shares, well below the roughly 22 million shares that accompanied a previous support reaction.
Price still respected the chart. SMH found support near $541, where the former upper boundary of the rising parallel channel from the April 2025 lows now acts as a breakout-retrace level. That is constructive structure, but the lighter volume makes the next daily close more important than today’s intraday recovery.
A sustained move above the neckline would continue to weaken the bearish pattern. A close back beneath it would restore the pattern’s relevance and show that today’s gap was primarily a positioning reset rather than a lasting breakout.
The individual semiconductor charts reinforce the same message:
- Western Digital recovered its neckline but is approaching resistance near $620 at the lower boundary of its rising channel.
- Micron tested its neckline near the session low before recovering, with channel resistance near $1,018.
- SanDisk closed above its neckline near $1,515 and now faces resistance near $1,600. The channel midpoint near $1,792 remains the larger upside reference.
The sector improved today, but the next session must show whether buyers can build on that recovery with stronger participation.
Yields and Oil Did Not Support the Equity Rally
The macro backdrop made the light-volume advance harder to trust.
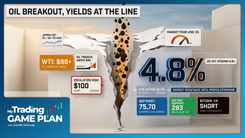
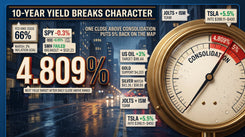
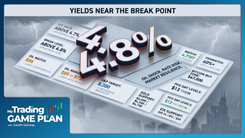
The 10-year Treasury yield pushed toward 4.63%, bringing the July highs back into play and placing the May peak near 4.687% within reach. Higher yields increase financing costs and raise the discount rate applied to future earnings, creating pressure for long-duration growth stocks.
Technology shares rallied anyway.
Oil also continued higher amid escalating tensions in the Middle East. Resistance sits near $85.75, followed by a declining trendline near $88.34 from the April pivot high.
Rising oil prices increase pressure on consumers and complicate the inflation outlook. When equities advance while both yields and energy costs rise, the market needs strong participation to show that investors are willing to look through those headwinds.
That participation was missing today.
The divergence does not guarantee an immediate reversal, but it makes volume confirmation essential. Price has started to repair the technical damage. The macro environment has not.
Gold, Silver, and Bitcoin Are Sending Different Signals
Gold gained 1.84%, but the larger structure remains constrained beneath horizontal resistance near $4,082. Above that level, additional resistance sits near $4,098, $4,149, and $4,178 before gold can reclaim its former rising channel.
Silver showed better relative strength by breaking above a multiweek declining trendline. A confirmed close above $58.39 would strengthen the case for a move toward the prior pivot near $63.27. Even at that level, however, silver would remain within the boundaries of its broader bear flag.
Bitcoin continues to show the cleanest constructive structure of the three. After holding support inside its parallel channel near $64,297, Bitcoin advanced 1.73%. The next major test sits at the June pivot near $67,264, followed by a heavier resistance zone between roughly $70,700 and $73,000.
Bitcoin’s series of higher lows and successful support tests reflects more consistent accumulation than the light-volume recovery seen across equities.
News Moved Individual Stocks, but the Charts Still Defined the Reactions
Nebius Group surged after Nvidia announced a $2 billion investment, sending the stock through several resistance levels in one session. NBIS cleared the top of its parallel channel near $197.09, moved through gap-fill resistance around $200, and traded near $220 after hours.
The next major resistance level sits near $232.09.
Even during the news-driven advance, price paused at a declining trendline before continuing higher. That reaction reinforced one of Drew’s recurring points: major catalysts can accelerate a move, but technical levels still influence where price pauses, consolidates, or reverses.
Teradyne offered the opposite setup. The stock received an analyst upgrade and a $500 price target, but its chart remains below the rising trendline it lost during the July breakdown. After finding support near $319, TER is now retesting that former support near $383.67.
Broken support often becomes resistance. The analyst upgrade may improve sentiment, but the chart requires a daily close above the trendline before the prior bullish structure is restored.
Earnings Put Confirmation at the Center of the Next Session
Tesla reports after tomorrow’s close after bouncing from rising trendline support near $354 to $355. The next meaningful resistance sits near $407.
Alaska Airlines is testing support around $43.68 following its earnings reaction, while Freeport-McMoRan remains inside a tight consolidation. FCX needs to reclaim the $62.95 to $63 area, with $64 marking the next important barrier and $66.06 serving as the larger upside reference.
On the monthly chart, 3M continues to develop a broad inverse head and shoulders pattern. The stock has rallied more than 30% from its April 2025 retracement, but the structure remains incomplete beneath neckline resistance near $174.70.
A monthly close above that level would confirm the pattern and bring the longer-term measured move near $278.86 into focus, with psychological resistance near $200 and $250 along the way.
The Bottom Line
Today’s rally repaired several bearish technical developments, but it did not resolve the market’s larger question.
The S&P 500, QQQ, and semiconductor stocks reclaimed important levels while volume remained light. At the same time, Treasury yields and oil prices moved higher, adding pressure beneath the surface.
Probability favors treating today’s move as an early recovery attempt rather than a fully confirmed shift in trend. The next session needs to deliver stronger volume and sustained closes above the reclaimed semiconductor necklines. Without that participation, today’s strength is more consistent with short covering than durable institutional demand.
Price improved. Conviction still needs to catch up.
Trading involves substantial risk. All content is for educational purposes only and should not be considered financial advice or recommendations to buy or sell any asset. Read full terms of service.