Trading The Close Market Recap - 09/03/2026: Dollar Decline Fuels Equity Rally — Jobs Report to Decide SPY, QQQ & Bitcoin

The market got the tailwind it needed Thursday. The 10-year Treasury yield backed away from recent highs, the dollar dropped into support, and buyers returned to equities with substantially more participation than the previous session.
That explains the bounce. It does not yet confirm a breakout.
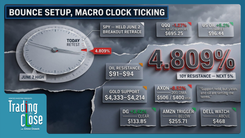
Drew Dosek's more important read in Thursday's Trading The Close is that SPY and QQQ have now rallied directly into the levels where the rebound has to prove itself. After three sessions of selling and roughly three sessions recovering that decline, both major index ETFs are pressing resistance with a jobs report due Friday morning.
The macro move got price there. The next data release may decide whether it gets through.
The Dollar Is the Anchor
The cleanest intermarket chart is the U.S. dollar.
The dollar sold sharply Thursday and reached the lower portion of an inclining parallel channel, near the same technical area tested on August 21. That matters because the dollar's decline coincided with strength across equities, precious metals and Bitcoin.
The relationship is straightforward. When the dollar weakens, dollar-denominated assets can receive a relative tailwind. That does not mean every decline in the dollar automatically produces higher asset prices, but Thursday's tape showed the relationship clearly.
For the broader market, that makes the dollar's current support test more useful than simply noting that stocks rallied. If dollar support holds and price starts reversing higher, one of Thursday's major tailwinds begins to fade. A clean break below the channel would keep that pressure pointed in the opposite direction.
The 10-year yield supplied the second half of the macro setup. It traded down toward 4.73% before recovering somewhat, easing a source of pressure that had weighed on risk assets.
Together, lower yields and a weaker dollar gave equities room to rebound. Now the equity charts have reached their own test.
SPY Recovered the Decline and Ran Into Resistance
SPY gapped higher and extended the move through the morning, but most of the progress was made before roughly 11:30 AM. From there, price stopped advancing and settled underneath a declining trend line.
That is the part of Thursday's rally that deserves attention.
Drew described the sequence simply: three days down, followed by roughly three days bouncing back into resistance. In other words, the market has repaired the recent decline, but it has not yet proven that the structure above it has changed.
Friday's jobs report arrives directly into that test.
A push through resistance after the release would strengthen the bullish read because buyers would have cleared the level that stopped Thursday's rebound. A rejection would leave the recovery looking more like a retracement into resistance than the beginning of another sustained leg higher.
QQQ is slightly stronger, having pushed through a nearby gap area while gaining 1.19%, but it faces a similar problem. Another descending trend line sits overhead, and previous encounters with that line have produced meaningful rejections.
That gives Friday a simple technical framework. The data itself matters, but the reaction at resistance matters more.
Nvidia and SMH Show the Same Problem
The semiconductor complex is reinforcing that broader-market read.
Nvidia has gained more than 6% over the past three sessions, but the rebound has carried the stock into a cluster around $232 where an inclining trend line and a previous pivot converge.
That is not a reason to assume Nvidia must turn lower. It is a reason to demand confirmation before treating the recent advance as open-ended.
A sustained break above the cluster would shift attention toward the midpoint of Nvidia's longer-term parallel channel and, beyond that, its prior highs. Failure to clear it keeps the current resistance intact.
SMH is even cleaner. The semiconductor ETF remains underneath a declining trend line, leaving the bounce technically incomplete. Drew is watching $553.77 as the level that would strengthen a breakout attempt, with $569.65 above it as the next technical objective. If the broader market turns lower instead, $533.91 is the support level back in focus.
This is why the semiconductor charts matter more than their individual percentage moves. They are testing resistance at the same time the major indices are doing it.
Dell Shows What Happens When Price Reaches the Other Side of the Move
Dell offers the clearest single-stock example of why resistance still matters in a strong tape.
After breaking its declining trend line and extending higher following earnings, the stock ran directly into resistance near $527.60. Price printed a topping tail on the 10-minute chart and then backed away toward $509.
The lesson is not that the earnings move failed. The breakout remains meaningful. The point is that an extended stock eventually reaches a level where the risk-reward changes.
For Drew, a pullback toward the broken declining trend line would be more informative than chasing price immediately after the surge. If that former resistance begins acting as support, the breakout structure remains constructive. If momentum continues instead, the top of the broader parallel channel near $582.71 becomes the next technical objective.
Dell is therefore a useful micro version of the broader market: a breakout can be valid and still require another test before the next leg becomes attractive.
Gold, Silver and Bitcoin Confirm the Dollar Move
The weaker dollar also showed up clearly outside equities.
Gold advanced toward $4,471, leaving $4,575 as the next significant resistance area on Drew's chart. Silver gained 2.41% and moved closer to resistance at $67.99.
Bitcoin delivered the strongest move of the group.
Price broke through a major declining trend line that had capped the cryptocurrency for months. The breakout itself is important, but Drew is looking for confirmation through a daily close above $82,920.
That distinction matters.
An intraday break says buyers attacked resistance. A close above it would provide stronger evidence that the level has actually changed character. If that happens, the December 2025 low just under $85,000 becomes the next resistance area in focus.
That makes Bitcoin one of the cleaner confirmation charts heading into the next session.
HOOD and Campbell Show Two Different Kinds of Repricing
Thursday's earnings movers also illustrated how technical structure absorbs fundamental news.
Robinhood surged 16.57% and broke through a descending trend line that had repeatedly capped price. But the move immediately reached another historical resistance line near Thursday's highs.
That creates a second test almost as soon as the first one was cleared. Holding above the breakout while clearing the new resistance would improve the structure and put the $135 area in focus. A rejection would show that even a powerful earnings move can run into existing supply.
Campbell's chart sits at the opposite end of the spectrum.
The stock dropped nearly 7% following its earnings release and dividend announcement, then tested a previously broken inclining trend line. The longer-term picture remains weak, with Campbell in a broad decline stretching back years.
If price cannot reclaim that broken structure, Drew's longer-term channel points toward approximately $19.85 as a potential downside technical objective.
Both charts make the same broader point: news changes the urgency of the move, but the chart still tells you where that move begins meeting opposition.
The Jobs Report Is a Confirmation Event, Not a Prediction Contest
Thursday answered one question. Buyers were willing to return as yields eased and the dollar weakened.
Friday asks a harder one.
Can SPY and QQQ clear resistance after recovering most of the recent decline?
That is the decision point Drew's charts have created. A favorable reaction to the jobs report that carries the indices through resistance would strengthen the case that the rebound has more room. A rejection would leave the market with three days down, three days back up, and a failed attempt to escape the same technical ceiling.
The dollar, Nvidia, SMH and Bitcoin provide confirmation underneath that framework, but the hierarchy is clear.
The macro tailwind produced the bounce. The resistance test decides whether it becomes something more.
Trading involves substantial risk. All content is for educational purposes only and should not be considered financial advice or recommendations to buy or sell any asset. Read full terms of service.