Trading The Close Market Recap - 10/20/2026: Earnings Season Kicks Off: NASDAQ Tension, Semiconductors, Oil & Gold Outlook

Stock Market Bounce Faces Earnings Test as Nasdaq and Semiconductors Struggle
The stock market managed to stabilize on Tuesday, October 20, but the recovery is running into a familiar problem. Buyers are defending important support levels without yet proving they can reclaim resistance. With technology earnings approaching and Treasury yields still elevated, the difference between a temporary bounce and a sustainable recovery is becoming increasingly important.
That was the central theme of Drew Dosek's latest Trading the Close market analysis for Verified Investing. The S&P 500 held its rising support trend line, but the Nasdaq remained beneath a key technical barrier, and semiconductor stocks failed to respond convincingly to a pullback in Treasury yields. Earnings season could provide the catalyst for a larger move, but the charts have not confirmed its direction.
For traders, the question is not whether stocks can bounce. They already have. The question is whether that buying can survive the next test of resistance. Until that happens, protecting capital and waiting for confirmation remain more important than anticipating a breakout.
S&P 500 Holds Trendline Support, but Nasdaq Resistance Remains the Bigger Test
The S&P 500 finished the session higher after defending an inclining trend line that has been in focus since Friday. That is constructive for the bulls, particularly following the failure of a recent bull flag pattern. However, defending support and rebuilding a bullish structure are two different things.
A failed bull flag can leave buyers who entered expecting a continuation rally facing a difficult decision. If price cannot recover the broken structure, subsequent rallies may attract selling from traders looking to reduce exposure. The S&P 500's sideways consolidation therefore deserves attention, even with Tuesday's positive finish.
The Nasdaq is showing a more immediate technical challenge. Following a sharp decline beneath a previously important trend line, the index has repeatedly attempted to recover that level without securing a convincing close above it.
Drew compared the Nasdaq's repeated tests to someone hanging from a pull-up bar, trying to regain their footing. The analogy captures the technical struggle. Buyers are attempting to reclaim former support, but each unsuccessful test leaves resistance intact.
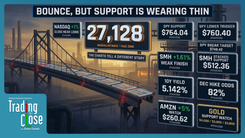
The important Nasdaq level is 26,579. A daily close above that threshold would strengthen the near-term bullish case and suggest that buyers are beginning to repair the breakdown. Continued rejection would leave the index vulnerable to additional consolidation or selling.
The divergence matters because the S&P 500 can remain relatively stable while technology leadership weakens. A healthier recovery would ideally include both broad-index support and renewed strength in the growth sectors that have helped drive market performance.
Treasury Yields Pull Back, but Semiconductor ETF SMH Fails to Rally
One of the more revealing developments came from the bond market. The 10-year Treasury yield pulled back after a recent advance, remaining within the broader 5.021% to 5.289% range identified in Drew's analysis.
The preceding move higher had produced a topping tail, suggesting that buyers of yields were encountering resistance. The subsequent retreat toward an earlier September pivot added weight to the possibility of near-term consolidation.
Lower yields can provide relief for growth stocks by reducing pressure on valuations and financing expectations. That relationship is particularly relevant to technology and semiconductor companies, where expectations for future earnings often account for a meaningful portion of market valuations.
Yet the VanEck Semiconductor ETF (SMH) declined approximately 0.38% during the session despite the pullback in yields.
That lack of confirmation is more useful than the yield move alone. If one source of pressure is easing but semiconductors are still struggling, traders need to consider whether earnings uncertainty, profit-taking, or weakening momentum is limiting demand.
SMH remains within a longer-term rising parallel channel, with important support near \$529.50 and resistance around the channel's midpoint at \$564.25.
A sustained move above the midpoint would improve the technical outlook, while a breakdown through channel support would signal more significant deterioration. Until either boundary is resolved, the ETF remains in a consolidation that could become increasingly sensitive to earnings announcements.
The takeaway is straightforward: a decline in yields is potentially helpful for technology stocks, but it is not a buy signal by itself. Price action still needs to confirm that buyers are responding.
GE Earnings Highlight the Breakdown-Retest-Fade Trading Setup
Earnings season is bringing another important consideration into focus. A strong company or widely followed earnings report does not automatically translate into bullish price action. The location of the stock on its chart can matter just as much as the announcement.
General Electric (GE) provided an example of the breakdown-retest-fade setup Drew discussed during the show.
After losing an important rising trend line, GE rallied back toward the underside of that broken support. Rather than reclaiming the level, the stock encountered resistance and turned lower.
This sequence is important because former support can become resistance once it breaks. Traders who bought near the original trend line may use a recovery toward their entry price to exit, while bearish traders may view the failed retest as an opportunity to define risk against a nearby technical level.
For GE, the next downside area identified in the analysis is approximately \$285, where a prior gap and support zone could attract attention.
That target is conditional. A sustained recovery above the broken trend line would weaken the bearish interpretation, while continued rejection would keep the downside level in focus.
RTX presented a different challenge. Its chart was also testing a potential breakdown-retest structure, but geopolitical developments were creating additional uncertainty around defense stocks.
The lesson is that technical setups do not operate independently of news. When an industry is exposed to major geopolitical developments, traders need to account for the possibility that a headline can interrupt an otherwise orderly chart pattern.
Netflix Earnings Selloff Puts Fibonacci Support Near \$61.29 in Focus
Netflix offered another example of why technical levels matter after earnings volatility.
Following its earnings-related decline, the stock traded near \$65 in the after-hours session described in the original recap. Drew examined the larger Fibonacci retracement structure drawn between the May 2022 low and June 2025 high.
The stock initially reacted around the 50% retracement level, demonstrating how widely observed technical areas can become decision points during sharp moves.
However, an initial bounce from support does not establish that the correction has ended. When price has already tested or moved through an important retracement level, traders need to assess whether subsequent buying is strong enough to rebuild the chart.
The next Fibonacci level highlighted in the analysis sits near \$61.29, with additional historical pivot support around \$58.75.
These levels provide a framework for evaluating further weakness rather than a prediction that both targets must be reached. If buyers reclaim the broken support structure, the bearish setup would begin to lose strength.
For traders watching earnings reactions, the larger lesson is to separate the initial move from the follow-through. The first bounce can be meaningful, but what happens when price returns to resistance often provides better information about the strength of demand.
Oil Prices Swing Around \$98 as Middle East Headlines Complicate the Chart
Outside equities, crude oil demonstrated how quickly geopolitical developments can change intraday price action.
Oil experienced a sharp decline and recovery amid reports and speculation surrounding potential Middle East peace negotiations. The session produced a wide-ranging doji-style candle, reflecting a market that moved aggressively in both directions without establishing a decisive closing advantage.
The important technical pivot remains near \$98.01.
Despite the intraday volatility, Drew's chart analysis identified a developing inverse head and shoulders structure. The bullish scenario would gain credibility with a sustained move above \$103.88, potentially bringing the pattern's measured-move objective near \$116 into focus.
The bearish alternative remains relevant. If geopolitical developments reduce concerns about supply disruptions and oil loses its current support structure, the next downside levels to monitor are approximately \$93.02 and \$86.90.
These competing scenarios illustrate why a headline-driven market requires flexibility. The same chart can contain a bullish pattern and meaningful downside risk, especially when the next major catalyst is difficult to forecast.
Rather than assuming that a particular geopolitical outcome will occur, traders can use the chart's support and resistance levels to determine which scenario is gaining confirmation.
Gold and Silver Remain Under Pressure as Traders Watch Lower Support
Precious metals are also showing signs of technical weakness, although gold and silver are approaching their respective support structures differently.
Gold has moved below the important \$3,900 pivot and is developing a bearish consolidation pattern. If that structure resolves lower, the next major areas include an inclining long-term trend line slightly above \$3,600 and historical support near \$3,500.
Drew described the region around the rising trend line as a potential "honeypot zone" for buyers. The phrase captures an important trading concept: an area where multiple technical considerations may encourage traders to look for a reaction.
That does not mean buyers must appear there. A support zone becomes more meaningful when price actually responds, ideally with evidence of stabilization or a reversal.
Silver has held relatively better above its recent lows but remains exposed to a broader head and shoulders structure. The pattern's measured-move target sits near \$53.26, with the psychological \$50 level representing another potential support area.
If silver's shorter-term bullish consolidation fails, those lower levels become more relevant. Conversely, a recovery through nearby resistance would reduce the immediate downside pressure.
For both metals, the distinction is between identifying a potential buying area and having a confirmed buying setup. Traders can prepare for support without assuming that the first touch will produce a lasting reversal.
Bitcoin Holds \$80,524 as Traders Watch for a Recovery Toward \$89,926
Bitcoin is showing a different form of resilience. Despite bearish consolidation on the daily chart, price has continued to hold above the important \$80,524 support level identified in Drew's analysis.
That area previously acted as resistance, making its current role as support technically significant. When a former resistance level holds during a pullback, it can indicate that buyers are willing to defend higher prices than they were during the preceding trading range.
The next important upside reference is approximately \$89,926, corresponding to the broken neckline of a larger head and shoulders pattern.
Before that level comes into play, Drew wants to see a stronger consolidation structure develop around \$86,000 to \$86,500. Holding that higher range would suggest that buyers are building a more stable base rather than relying on a single sharp rally.
A loss of \$80,524 would weaken the constructive interpretation and require a reassessment of the near-term setup.
The broader point is that Bitcoin's ability to defend support is encouraging, but the next stage of the recovery still needs confirmation through price structure.
What Traders Should Watch Next as Technology Earnings Accelerate
The next several sessions will test whether Tuesday's stabilization can develop into a more convincing recovery.
The Nasdaq's 26,579 resistance level remains one of the clearest near-term signals. A sustained reclaim would suggest improving technology-sector momentum, particularly if semiconductor stocks begin participating more convincingly.
SMH is another important confirmation tool. A recovery toward its \$564.25 channel midpoint would improve the bullish case, while weakness toward \$529.50 would raise questions about the durability of the broader market bounce.
Treasury yields remain part of the equation. Continued consolidation within the 5.021% to 5.289% range could ease some pressure on growth stocks, but a renewed move toward the upper boundary would bring valuation concerns back into focus.
Earnings reactions will also provide useful information about investor positioning. Traders should pay attention not only to whether companies beat expectations, but also to how their stocks behave around established technical levels after results are released.
A strong report followed by a failed breakout can reveal resistance. A disappointing report followed by a successful support test can reveal demand. In both cases, the market's reaction provides information that the headline alone cannot.
Bottom Line: The Stock Market Needs Confirmation, Not Just a Bounce
Tuesday's market action showed that buyers are still willing to defend important levels. It did not establish that the recent technical damage has been repaired.
The S&P 500 is holding support, but the Nasdaq has not reclaimed resistance. Treasury yields have pulled back, but semiconductors have not responded with convincing strength. Meanwhile, earnings announcements are beginning to test individual stocks against established technical structures.
That combination favors a patient, level-driven approach rather than chasing short-term moves.
Drew's analysis reinforces a principle that applies across stocks, commodities, and cryptocurrencies: the strongest trading decisions begin with a clearly defined setup, an identifiable invalidation level, and the discipline to wait for price to confirm the thesis.
As earnings season accelerates, the opportunity is not simply in predicting the next move. It is in recognizing when the market has provided enough evidence to act.
Trading involves substantial risk. All content is for educational purposes only and should not be considered financial advice or recommendations to buy or sell any asset. Read full terms of service.