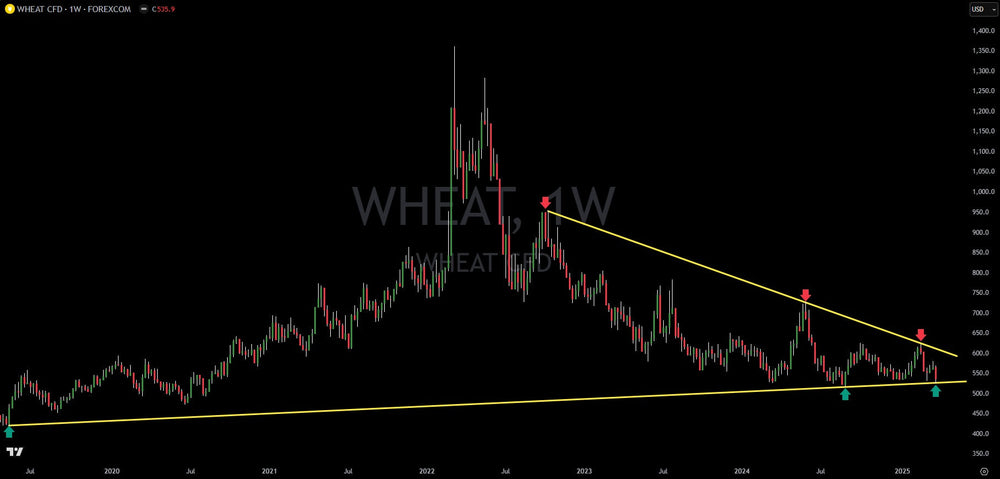
Commodity Wheat At Critical Support Level

The global wheat market has experienced significant volatility in recent years, and the commodity is currently at an interesting juncture. After an initial surge to $1,365 per ton in the immediate aftermath of the Russian invasion of Ukraine – an event that severely disrupted global supply chains – wheat prices have been in a persistent downtrend. This decline reflects a combination of factors, including the market's adaptation to the altered supply landscape, improved weather conditions in some key growing regions, and potentially shifts in global demand.
Currently trading around $535.9 per ton, wheat finds itself testing a critical long-term support level. This area has historically acted as a floor for price declines and is therefore closely watched by market participants.
A key technical observation is the presence of a well-defined upward-sloping trend line that connects the significant low established in 2019 with the low reached in 2024. The fact that the current price is interacting with this trend line suggests its continued relevance as a support level.
Adding another layer to this analysis is a downward-sloping trend line formed by connecting the series of lower highs observed in October 2022, May 2024, and most recently in February 2025. When these two trend lines – the ascending support and the descending resistance – converge, they create a classic wedge pattern.
In technical analysis, wedge patterns are often interpreted as consolidation phases that precede a significant price movement in either direction. The narrowing range within the wedge indicates a period of indecision, which is typically resolved by a breakout or breakdown.
Therefore, wheat is currently at a pivotal point. Traders and analysts should closely monitor price action around the key levels identified.
-
Breakdown Scenario: A confirmed break below the $525 level would strongly suggest that the long-term support has failed. This breakdown could trigger a significant sell-off, potentially leading to the next major support level, which is estimated around $422. This target is likely derived from previous price action or Fibonacci retracement levels (though these are not explicitly mentioned in the original text).
-
Breakout Scenario: Conversely, a confirmed breakout above the $600 mark would indicate that the downward pressure has been overcome. This could signal the start of a substantial upward move, with a potential target around $950. This target likely represents a significant resistance level or a measured move based on the height of the wedge pattern.
Wedge patterns are indeed valuable tools for technical traders as they provide clear entry and exit points based on confirmed breaks. The current chart of wheat presents a compelling opportunity for commodity traders to capitalize on the anticipated volatility that often follows the completion of such patterns. It's crucial to emphasize the need for confirmation – ideally through increased trading volume and sustained price movement beyond the breakout or breakdown level – before acting on these potential scenarios.
Trading involves substantial risk. All content is for educational purposes only and should not be considered financial advice or recommendations to buy or sell any asset. Read full terms of service.


