GDX's Brutal Reality Check: When Former Support Becomes Your Worst Enemy
Sometimes the most powerful technical setups are hiding in plain sight, and right now, the VanEck Gold Miners ETF (GDX) is painting a textbook example of why understanding support and resistance dynamics can make or break your trading account.
I've been watching this pattern develop for months, and what we're seeing in GDX represents one of my favorite high-probability setups – the classic support-turned-resistance scenario that continues to punish bulls who refuse to acknowledge the new reality.
Now, let me be crystal clear about my positioning here: I remain bullish on GDX from a long-term perspective. The fundamentals supporting precious metals and mining companies haven't disappeared. But as a swing trader, I've learned that fighting short-term technical realities in favor of long-term convictions is a recipe for painful losses. This resistance zone setup offers what I believe could be a solid 10% pullback opportunity for those willing to trade the pattern rather than their wishful thinking.
Let me walk you through exactly what's happening here, because this chart tells a story that every trader needs to understand.
The Great Role Reversal
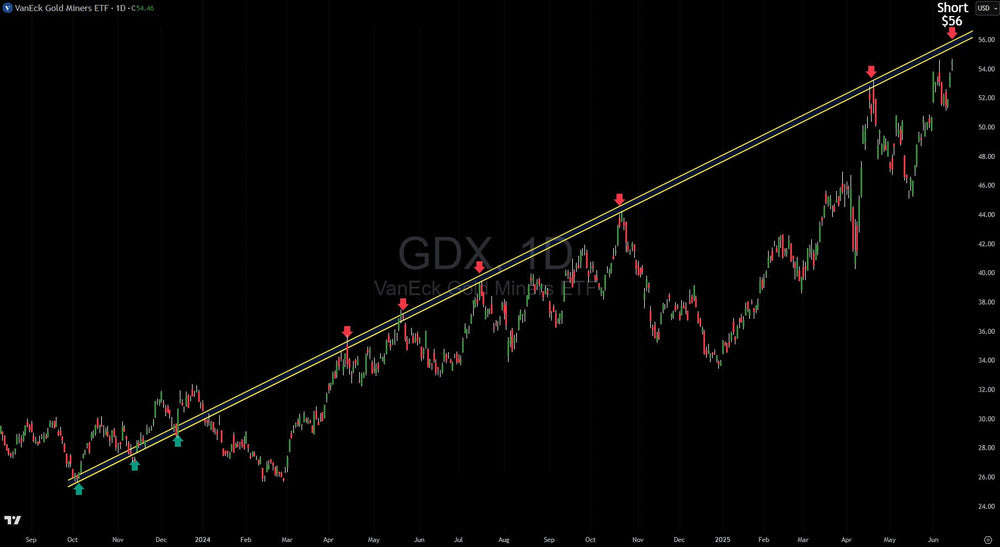
Back in 2023, that yellow trendline zone you see on the chart was GDX's best friend. Time and again, when selling pressure mounted and the gold miners looked vulnerable, that area stepped up as reliable support. Buyers emerged, dip-buyers got rewarded, and the upward trajectory remained intact.
But markets have a way of humbling even the most confident participants. What served as a launching pad in 2023 has transformed into an impenetrable ceiling throughout 2024 and into 2025. This isn't just any resistance – this is former support that has flipped roles, and that makes it particularly dangerous for anyone betting on upside breakouts.
The psychology behind this phenomenon fascinates me every time I see it play out. Those same price levels that once attracted aggressive buying now serve as a reminder of what was lost. Previous buyers who got trapped above these levels become sellers on any rally back to their break-even points. It creates this self-reinforcing cycle of selling pressure that can persist for extended periods.
The Rejection Pattern That Keeps Delivering
Look at those red arrows scattered across the chart – each one marking another failed attempt to reclaim what was once friendly territory. We're not talking about one or two halfhearted tests here. This resistance zone has faced multiple serious challenges, and each time, it has turned back the bulls with increasing authority.
What strikes me about these rejections is their consistency. This isn't random price action bouncing around unpredictably. Instead, we're seeing a methodical process where each approach to the resistance zone meets with selling pressure that overwhelms any bullish momentum. That's the kind of pattern that builds confidence in a technical setup.
The most recent rejection appears particularly telling. Notice how price approached the zone with what looked like genuine conviction, only to get turned away once again. That's the market's way of sending a clear message about where the real power lies in this tug-of-war between buyers and sellers.
Why $56 Represents the Sweet Spot
The "Short $56" annotation on the chart isn't arbitrary – it reflects a calculated assessment of where probability tilts most heavily in favor of another rejection. This level sits right in the heart of that resistance zone, where the technical evidence suggests selling pressure should emerge with force.
From a risk-reward perspective, this setup offers something that's increasingly rare in today's markets: a high-probability trade with a clearly defined invalidation point. Based on the pattern's behavior, a rejection from $56 could easily deliver that 10% pullback I'm targeting – potentially taking GDX back toward the $50-51 range where the lower channel support has historically provided buying opportunities.
But here's what makes this particularly compelling: the pattern of respect this resistance zone has commanded suggests that any approach to $56 should trigger the same selling response we've witnessed repeatedly. The market has essentially trained itself to view this area as a ceiling, and changing that perception would require sustained buying pressure that we simply haven't seen.
The Support Bounces Tell Their Own Story
While the resistance rejections grab most of the attention, those green arrows marking support bounces along the lower boundary reveal another layer of the technical picture. Even as the upper boundary has turned hostile, the lower trendline continues to attract buying interest when price ventures into oversold territory.
This creates what I call a "contained environment" – price action that's essentially trapped between well-defined boundaries. The lower boundary offers opportunities for tactical long positions, while the upper boundary provides high-probability short setups. For traders who understand these dynamics, it's like having a roadmap for the most likely price behavior.
The key insight here is recognizing that we're dealing with a mature pattern that has established its own internal logic. Price doesn't break these boundaries easily because too many market participants have learned to respect them. That makes trading within the channel more predictable than trying to time a breakout that may never materialize.
Reading the Market's Body Language
What really catches my attention in this setup is how price behaves as it approaches the resistance zone. There's often a subtle shift in momentum that precedes these rejections – a loss of buying urgency that experienced traders learn to recognize.
Volume patterns can also provide valuable clues, though they're not always definitive. When price approaches resistance on declining volume, it often signals that the buying interest isn't robust enough to overcome the selling pressure waiting above. Conversely, heavy volume rejections can indicate institutional-level selling that retail traders would be wise to respect rather than fight.
The broader market context also matters here. Gold miners have faced headwinds from various sources – rising interest rates that make gold less attractive, operational cost pressures, and shifts in investor sentiment toward other sectors. These fundamental factors provide the backdrop against which our technical analysis plays out.
Managing the Risk Landscape
Every technical setup comes with its own risk profile, and this one is no exception. The most obvious risk to a bearish stance would be a decisive break above the resistance zone, particularly if accompanied by strong volume and broader market strength in precious metals.
From a timing perspective, the key is recognizing that these rejection patterns don't always play out immediately. Sometimes price can probe the resistance zone for several sessions before the selling pressure materializes. Patience becomes crucial – rushing into positions based on the first touch of resistance can lead to premature stops and frustrating whipsaws.
Position sizing also deserves careful consideration. While the probability may favor another rejection, no technical pattern is guaranteed. The traders who survive long-term are those who size their positions to weather the occasional trade that doesn't work out as expected.
The Bigger Picture Context
This GDX pattern doesn't exist in isolation – it's part of a broader story about precious metals and mining stocks in the current economic environment. Understanding that context helps explain why this resistance zone has proven so formidable and why it's likely to continue challenging any bullish attempts.
The Federal Reserve's monetary policy stance has created crosscurrents for gold-related investments. While inflation concerns support the precious metals narrative, higher interest rates make yield-bearing assets more competitive. This fundamental tension shows up in the technical patterns, creating the kind of range-bound behavior we're seeing in GDX.
Balancing Long-Term Bullishness with Short-Term Realities
I want to emphasize again that this tactical short setup doesn't conflict with a longer-term bullish outlook on precious metals. In fact, some of the best long-term investments experience these kinds of technical corrections that create better entry points for patient investors.
The difference lies in time horizon and strategy. As a swing trader, I'm looking to capitalize on high-probability technical patterns that can deliver quick gains – in this case, targeting that 10% pullback. Long-term investors might view any weakness as a buying opportunity, and they wouldn't be wrong from their perspective.
The key is matching your strategy to your timeframe and not letting long-term convictions blind you to short-term technical realities. Some of my best trades have come from temporarily trading against my longer-term bias when the technical setup was too compelling to ignore.
The Probability Game
At the end of the day, successful trading comes down to playing the probabilities. This GDX setup represents the kind of high-probability scenario that forms the foundation of consistent trading profits. The resistance zone has proven its mettle through multiple tests, and the risk-reward profile favors another rejection if price reaches the $56 area.
But remember – probability doesn't mean certainty. The market always retains the right to surprise us, and successful traders maintain the flexibility to adjust their stance when the evidence changes. That's what separates professional analysis from wishful thinking.
The technical evidence in GDX tells a clear story about where the balance of power currently lies. Those who choose to ignore that story do so at their own peril. Sometimes the most profitable trades are also the most obvious ones – you just need the discipline to take what the market is offering.
Whether you're a long-term bull looking to add to positions on weakness or a swing trader seeking quick profits from technical patterns, this resistance zone deserves your attention. The setup is there, the probabilities are clear, and the risk can be managed effectively. Now it's just a matter of waiting for price to reach that $56 sweet spot and let the pattern play out.
This article is intended for informational and educational purposes only and does not constitute financial advice. All trading involves risk. Past performance is not indicative of future results. Trading involves substantial risk. All content is for educational purposes only and should not be considered financial advice or recommendations to buy or sell any asset.
Trading involves substantial risk. All content is for educational purposes only and should not be considered financial advice or recommendations to buy or sell any asset. Read full terms of service.