Natural Gas Technical Analysis: Key Rejection at $4.00 Signals Potential Reversal
The natural gas market has been giving us quite the show lately, hasn't it? After months of navigating choppy waters, XNGUSD has finally arrived at what I believe is a critical inflection point - one that savvy traders should be paying very close attention to right now.
The Big Picture: Respecting the Trend Until It Breaks
Let's take a step back and look at what's been happening with natural gas since February. The yellow uptrend line I've marked on the chart tells a compelling story of buyer persistence. This isn't just any trendline - it's connected multiple significant lows over a three-month period, making it a powerful technical reference point.
What strikes me about this trendline is how consistently price has respected it. Each time natural gas has pulled back to test this boundary, buyers have stepped in with enough conviction to push prices higher. This kind of reliable price action is what technical analysts like myself live for - it gives us a concrete level to work with rather than shooting in the dark.
But here's where things get really interesting...
The Perfect Storm: Fibonacci Confluence with Trend
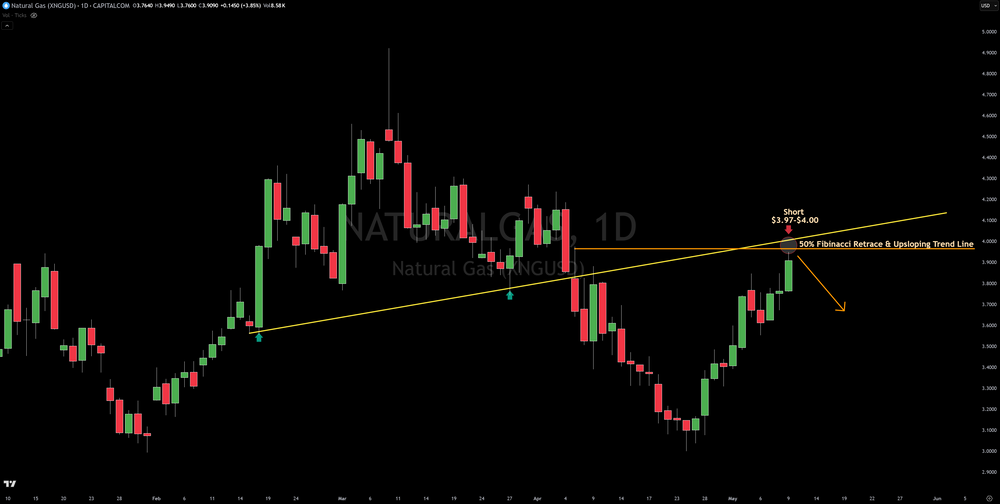
If you look at where we are right now, natural gas has rallied back to a critical zone where multiple technical factors are converging. We've got the 50% Fibonacci retracement level perfectly aligned with our upsloping trend line. In my 26 years of chart analysis and trading experience, these confluence zones - where different technical tools point to the same price area - tend to be the most reliable reversal points in any market.
Why does this matter? Well, Fibonacci retracements aren't just arbitrary lines on a chart. They represent psychological price levels where market participants often make decisions. The 50% retracement, in particular, is a level where we typically see either a confirmation of the trend's strength or the beginning of a reversal.
Notice how price has approached the $4.00 level and appears to be struggling with it. This isn't surprising given the technical significance of this zone. The $4.00 mark isn't just a round psychological number (though that certainly adds to its importance); it's also right where our key technical indicators are converging.
Recent Price Action: Reading Between the Candles
The recent price action tells us volumes about market sentiment. After a strong upward move from the March lows around $3.00, natural gas managed to climb back toward the $4.00 level. But I want you to pay special attention to those last few candles near our confluence zone.
See how we're forming those smaller bodies with longer upper wicks? That's the market equivalent of trying to push through a ceiling - there's effort, but not enough force to break through cleanly. These rejection candles suggest seller pressure is mounting precisely at our identified resistance zone.
The volume profile (though not explicitly marked) would typically show increased activity at this level, further confirming its significance as a battleground between buyers and sellers. Right now, it appears sellers are gaining the upper hand.
The Trade Setup: Potential Short Opportunity
This brings us to the actionable insight from this analysis. As the chart annotation indicates, there's a potential short opportunity in the $3.97-$4.00 range. This isn't just any trade setup - it's one with multiple technical factors aligning to increase its probability of success.
What makes this setup particularly compelling is the clear invalidation point. If natural gas decisively breaks above $4.00 and holds, that would likely invalidate the short thesis. This gives us a well-defined risk parameter - something that's absolutely essential for responsible trading.
The potential downside targets aren't explicitly marked on this chart, but based on previous support levels and the strength of the rejection at our confluence zone, we could reasonably look for a move back toward the midpoint of the recent range, perhaps around $3.50 initially, with further weakness potentially testing the uptrend line again.
Risk Management: Protecting Your Capital
Let's talk about what could go wrong with this analysis - because acknowledging uncertainty is what separates seasoned analysts from the crystal ball crowd.
If natural gas breaks and closes convincingly above the $4.00 level, particularly on higher-than-average volume, that would suggest buyers have overwhelmed the resistance. In that scenario, we could see a continued move higher, potentially targeting previous highs around $4.50.
Weather factors, storage reports, and geopolitical events can all cause natural gas to move in unexpected ways, regardless of technical setups. This is why position sizing and stop placement are crucial when trading natural gas, which can be notoriously volatile.
I'd suggest considering a stop loss slightly above the $4.00 level, perhaps at $4.05 or $4.10, depending on your risk tolerance. This gives the trade enough room to breathe while still protecting your capital if the thesis proves incorrect.
Broader Market Context: What's Driving Natural Gas?
While our analysis focuses on technical factors, it's worth noting that natural gas has been in a broader recovery phase after a significant decline throughout much of 2023 and early 2024. Seasonal factors typically support natural gas prices heading into summer in the Northern Hemisphere as cooling demand increases.
However, the market remains well-supplied, which could put a cap on any sustained rally - a fundamental backdrop that aligns with our technical resistance thesis.
The Bottom Line
The natural gas market is presenting us with a textbook technical setup at the moment. The confluence of the 50% Fibonacci retracement and the established uptrend line around the psychologically important $4.00 level creates a compelling zone for potential reversal.
For traders, this offers a high-probability short opportunity with clearly defined risk parameters. The recent rejection candles at this level further support the case for at least a near-term pull-back.
Could this be the beginning of a larger reversal in natural gas? The technical evidence certainly suggests it's possible. But markets rarely move in straight lines, and the established uptrend since February shouldn't be dismissed lightly.
What I find most valuable about this current setup is its clarity - we have a well-defined level to trade against, with clear signals for both continuation and invalidation. In the often murky world of commodity trading, that kind of clarity is worth its weight in gold - or in this case, natural gas.
As always, the market will have the final say, but positioning yourself in harmony with these high-probability technical setups is how consistent traders stay ahead of the curve. Keep a close eye on how price behaves around this critical $4.00 zone in the coming sessions - it should tell us a lot about where natural gas is headed next.
This technical analysis was written by Chief Market Strategist Gareth Soloway of VerifiedInvesting.com
This article is intended for informational and educational purposes only and does not constitute financial advice. All trading involves risk. Past performance is not indicative of future results. Trading involves substantial risk. All content is for educational purposes only and should not be considered financial advice or recommendations to buy or sell any asset.
Trading involves substantial risk. All content is for educational purposes only and should not be considered financial advice or recommendations to buy or sell any asset. Read full terms of service.