Bitcoin Technical Analysis For Investors

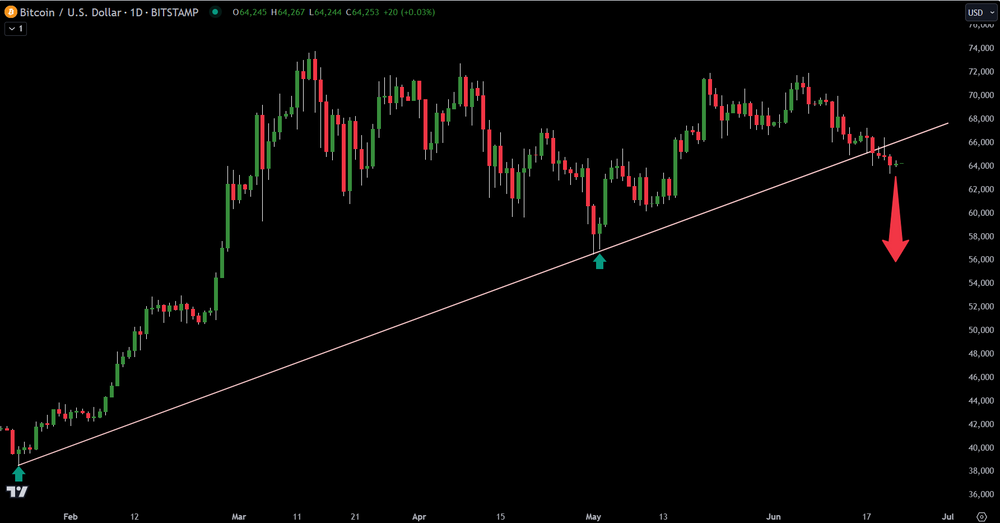
Over the last week, Bitcoin broke a major support trend line. This can be seen in the chart above. Based on this break of support, Bitcoin earns a negative bias. Per technical analysis, the price of Bitcoin can potentially fall to $61,000. Should it break that level, downside to $50,000 becomes very likely.
Price action on Bitcoin has been muted since its all-time high near $74,000. While long-term Bitcoin remains strong, near-term price action appears weak.
For Bitcoin to regain a bullish bias, price would need to recapture the broken support level at $66,500.
Trading involves substantial risk. All content is for educational purposes only and should not be considered financial advice or recommendations to buy or sell any asset. Read full terms of service.


