EUR/USD Breaks Free: Why This Classic Wedge Breakout Could Target 1.23
After months of sideways grinding that had many traders pulling their hair out, EUR/USD has finally delivered what technical analysts love to see—a textbook wedge breakout followed by the classic "return to scene of the crime." If you've been waiting for a clear directional signal in this major currency pair, the charts are now speaking loud and clear.
The Long Journey to This Moment
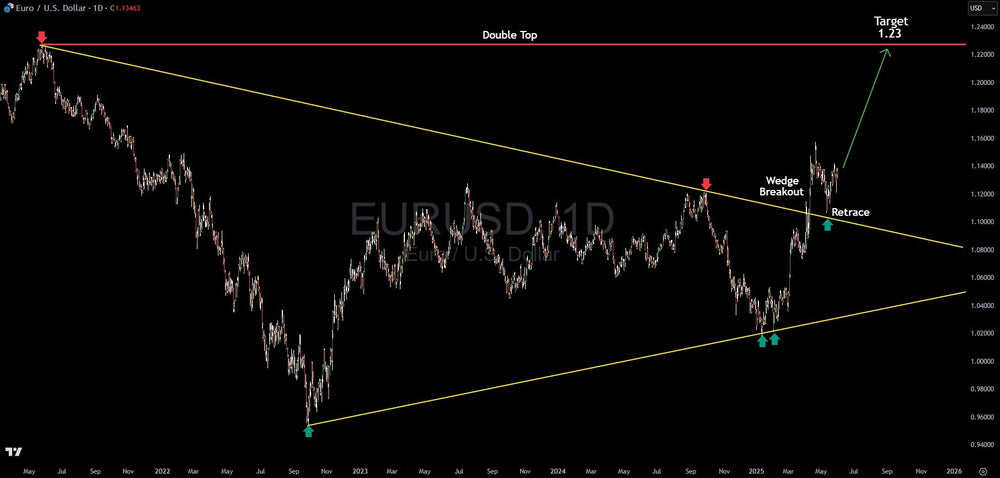
Let's step back and appreciate the journey that brought us here. EUR/USD has been trapped in what I like to call a "pressure cooker" pattern for the better part of two years. Since the double top formation back in 2021-2022, when the pair kissed those lofty highs above 1.20, we've witnessed a fascinating technical dance between buyers and sellers.
The story really begins with that significant double top pattern—a classic reversal formation that marked the end of the euro's post-pandemic strength. But rather than collapsing in a straight line, which many expected, EUR/USD chose a more methodical path downward, respecting a beautifully defined descending resistance trendline that originated from those 2021 peaks.
The Wedge That Changed Everything
What makes this setup particularly compelling is how perfectly the wedge pattern developed over time. Picture this: you have a descending yellow trendline acting like a ceiling, consistently pushing price lower whenever bulls tried to break free. Meanwhile, an ascending yellow trendline from the 2022 lows provided a reliable floor, preventing any catastrophic collapse.
This converging pattern—what we technical analysts call a symmetrical triangle or wedge—created an environment where volatility was literally being squeezed out of the market. Each bounce between these boundaries was getting smaller, each swing more predictable. It's like watching a spring get compressed tighter and tighter, building potential energy that eventually has to release.
And that's exactly what happened.
The Breakout Story Unfolds
Here's where things get really interesting, and why I believe we're looking at a genuine shift in momentum rather than just another false breakout. EUR/USD finally muscled its way above that descending resistance trendline—the same line that had rejected every rally attempt for over two years.
But the real beauty in this setup isn't just the initial breakout itself. It's what happened next that gets my technical analysis radar buzzing. After breaking above that resistance, EUR/USD did something that separates the men from the boys in trading: it came back to test that former resistance level as new support.
This is what we call the "return to scene of the crime," and it's one of the most reliable confirmation signals in all of technical analysis. Think about it—that yellow trendline spent months and months acting as an impenetrable barrier. Now that price has broken above it, that same line should theoretically act as support. And that's exactly what we're seeing play out.
Why This Retrace is Actually Bullish
Many inexperienced traders see a pullback after a breakout and immediately think the move is failing. But my 26 years in the markets have taught me that the opposite is often true. When price breaks out of a significant pattern and then successfully holds above former resistance during a retest, it's actually confirming the validity of the breakout.
It's like breaking through the roof of your house and then using that same roof as a floor for your new second story. The structure that once contained you now supports your next level of growth.
What we're witnessing with EUR/USD right now is this exact phenomenon. The currency pair has successfully retested that descending trendline and appears to be finding support right where theory suggests it should. This isn't just a lucky coincidence—it's the market validating the technical setup.
The Psychology Behind the Pattern
Let me share something about market psychology that many traders overlook. When a currency pair like EUR/USD sits in a lengthy consolidation pattern, it creates what I call "emotional scar tissue" among market participants. Traders become conditioned to expect failure at key levels because they've been burned so many times before.
But here's the thing about markets—they love to do what's least expected at the moment it becomes least expected. After months of failed breakout attempts, most participants had probably given up hope of any meaningful move. That's precisely when authentic breakouts tend to occur, when the majority have thrown in the towel.
This psychological dynamic is part of what makes the current EUR/USD setup so compelling. The breakout caught many off-guard, and the successful retest is now converting skeptics into believers.
Target Zone and What to Watch For
Based on the technical measurements from this wedge pattern, we're looking at a potential target around the 1.23 level. This isn't just a random number I've pulled out of thin air—it's derived from the height of the widest part of the wedge projected upward from the breakout point.
Will EUR/USD hit 1.23 in a straight line? Absolutely not. Markets rarely move in perfect straight lines, especially over longer timeframes. We should expect some backing and filling along the way, some temporary setbacks that test our patience. But the overall trajectory, if this analysis proves correct, should be higher.
The key areas I'm watching as we move forward include any meaningful breaks back below that ascending support trendline, which would suggest the wedge breakout was a false signal. I'm also keeping an eye on how price reacts around the 1.16-1.17 zone, which represents the next meaningful resistance level from previous price action.
Risk Management and Reality Check
Now, let's talk about what could derail this bullish scenario, because successful trading isn't just about being right—it's about managing risk when you're wrong. The most obvious invalidation signal would be a decisive break back below the ascending trendline support that forms the bottom of our wedge pattern.
If EUR/USD were to close convincingly below that ascending yellow line, it would suggest that the breakout was indeed a false dawn, and we might see a resumption of the broader consolidation or even lower prices.
Additionally, any significant shift in fundamental factors—whether related to European Central Bank policy, U.S. Federal Reserve actions, or broader risk sentiment—could override these technical signals. Technical analysis provides us with probabilities, not certainties, and it's crucial to remain flexible when market conditions change.
The Bottom Line
What we have developing in EUR/USD is a technically sound setup backed by solid pattern recognition and confirmation signals. The wedge breakout, followed by a successful retest of former resistance as new support, provides a foundation for potentially higher prices ahead.
For traders and investors who've been waiting for clarity in this major currency pair, the charts are now offering exactly that. The question isn't whether EUR/USD will face obstacles on its path higher—it absolutely will. The question is whether this technical foundation is strong enough to support a meaningful move toward that 1.23 target zone.
Based on what I'm seeing, and drawing from over two decades of chart analysis experience, I believe it is. But as always in trading, we'll let the market have the final say, and we'll adjust our expectations accordingly as new information develops.
The setup is there, the pattern has played out textbook style, and the risk-reward dynamics look favorable. Sometimes in this business, that's all you can ask for.


