USD/CAD: Why This Decade-Long Wedge Could Spark the Next Major Currency Move
As I scan through the currency markets this week, one chart keeps drawing my attention back like a magnet – the USD/CAD weekly timeframe. After more than a decade of methodical price action, we're witnessing what could be one of the most significant setups in this major currency pair's recent history.
What we're looking at here isn't just any ordinary technical pattern. The Loonie has been painting a textbook ascending wedge against the dollar since around 2014, and folks, we're now sitting right at the business end of this formation. The implications of what happens next could reverberate through currency markets for months, if not years.
The Wedge That's Been Ten Years in the Making
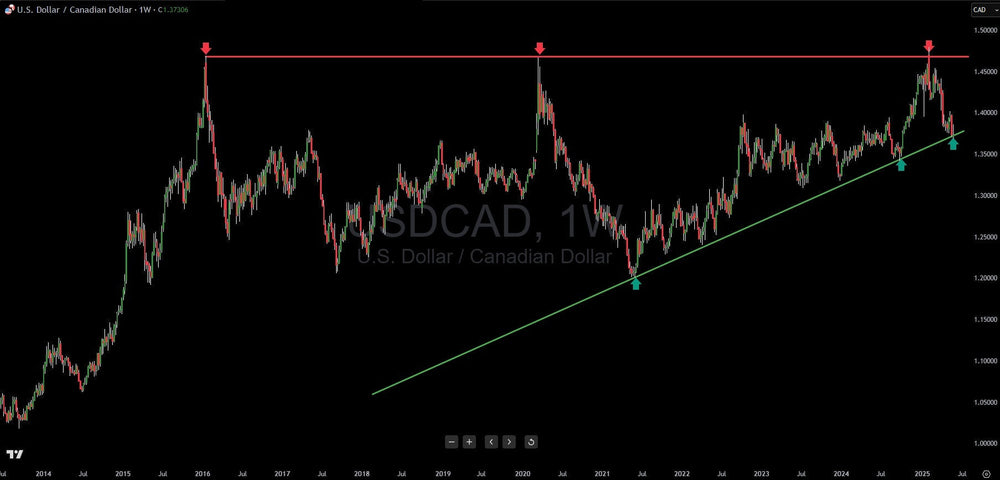
Let me walk you through what's been unfolding on this chart. Since the 2014 lows, USD/CAD has been riding a beautiful ascending support trendline that's acted like a reliable floor for the pair. I've marked several key touch points with green arrows where this trendline has provided excellent buying opportunities for those patient enough to wait for the setup.
But here's where it gets really interesting – while the support has been steadily rising, the resistance has remained stubbornly flat around that 1.46-1.47 level. Those three red arrows I've marked show you exactly where the sellers have stepped in with authority, creating what technical analysts call a "ceiling of resistance."
This creates our ascending wedge – a pattern that's inherently unstable because it represents a market that's running out of room to breathe. Think of it like a pressure cooker that's been heating up for over a decade. The steam has to escape somewhere, and when it does, it's going to be explosive.
Why the Break Could Be Spectacular
What makes this setup so compelling is the sheer timeframe we're dealing with. We're not talking about a few weeks or months of consolidation here – this wedge has been building for more then ten years. In my experience, the longer a pattern takes to develop, the more significant the eventual breakout tends to be.
The mathematics of the wedge structure tells us we're approaching a decision point. Price action is getting squeezed between these converging lines, and volume typically starts to compress as the pattern matures. It's like watching a coiled spring – the tension builds and builds until something has to give.
The Bull Case: When USD Strength Takes Control
If we see an upside breakout above that stubborn 1.47 resistance level, the implications could be far-reaching. From an economic standpoint, there are several scenarios that could fuel such a move.
The most obvious catalyst would be continued Federal Reserve hawkishness combined with Bank of Canada dovishness. If the Fed maintains higher rates while the BoC finds itself forced to cut more aggressively due to Canada's housing market vulnerabilities or economic softness, we could see significant divergence in monetary policy that favors the dollar.
Energy dynamics also play a crucial role here. While Canada benefits from higher oil prices, a global economic slowdown that pressures commodity demand could hurt the Loonie disproportionately. Canada's economy remains heavily tied to natural resources, and any sustained weakness in the commodity complex tends to flow through to the currency.
Additionally, if we see a broader "flight to quality" driven by global uncertainties – whether geopolitical tensions, banking sector stress, or other risk-off events – the dollar's reserve currency status typically shines. In such scenarios, money flows toward USD-denominated assets, creating sustained upward pressure on pairs like USD/CAD.
A confirmed break above 1.47 could target the 1.50-1.52 zone initially, with potential for even higher levels if the fundamental backdrop supports sustained dollar strength.
The Bear Case: Loonie's Potential Comeback Story
But let's not ignore the other side of this equation. A breakdown below the ascending support trendline could be equally dramatic, potentially sending USD/CAD back toward levels we haven't seen in years.
Furthermore, if the U.S. economy shows signs of significant weakness – forcing the Fed into aggressive rate cuts while Canada maintains stability – we could see the interest rate differential favor the Canadian dollar for the first time in years. Canada's relatively healthy banking system and lower debt-to-GDP ratio compared to some other developed nations could also become advantageous.
Energy sector dynamics could flip in Canada's favor as well. Any supply disruptions, increased demand from emerging markets, or shifts toward North American energy independence could boost oil prices substantially. Given Canada's position as a major energy exporter, sustained higher oil prices typically translate to a stronger Loonie.
Furthermore, if the U.S. economy shows signs of significant weakness – forcing the Fed into aggressive rate cuts while Canada maintains stability – we could see the interest rate differential favor the Canadian dollar for the first time in years.
A confirmed breakdown below the ascending trendline support could initially target the 1.32-1.30 area, with deeper retracements possible depending on the fundamental drivers.
The Trader's Dilemma: Patience Over Prediction
Now, here's where my 26 years of experience really comes into play, and it's the most important part of this entire analysis: despite having strong opinions about the technical setup and understanding the fundamental drivers, a disciplined trader never jumps the gun.
Wedge patterns are notorious for false breaks. I've seen countless traders get burned trying to anticipate which direction the break will occur, only to get whipsawed when the initial move fails and reverses violently. The market loves to test both sides of these formations before committing to the real move.
This is why we wait for confirmation. A true breakout needs to be sustained – we're talking about a weekly close well outside the pattern boundaries, preferably with increased volume to validate the move. I generally like to see at least a 1-2% move beyond the pattern boundaries before considering it a legitimate break.
For the upside, that means we need to see USD/CAD not just touch 1.47, but convincingly close above it and hold those gains. For the downside, we need to see the ascending support trendline not just touched, but decisively broken with follow-through selling.
Risk Management: The Non-Negotiable Element
Whichever direction this wedge eventually resolves, position sizing and risk management become absolutely critical. The potential for significant moves cuts both ways – while the profit potential is substantial, so is the risk if you're on the wrong side.
If I were positioning for either scenario, I'd be looking at wider stop losses given the weekly timeframe and the potential for volatility around the initial break. The invalidation point would be a move back inside the wedge after what initially appeared to be a confirmed breakout.
What I'm Watching Next
The coming weeks will be absolutely crucial for USD/CAD. We're at that point in the wedge where price action can't remain indecisive much longer. I'll be monitoring several key factors: Fed and BoC communications, oil price action, U.S. economic data trends, and of course, the technical behavior around our key levels.
The beautiful thing about setups like this is their clarity. Once the wedge breaks with conviction, the direction should become abundantly clear. Until then, patience remains our greatest ally.
Remember, the market will tell us what it wants to do – our job is simply to listen and respond accordingly. This USD/CAD wedge represents exactly the kind of high-probability, high-reward setup that can define a trading year. The question isn't whether it will break, but when and in which direction.
Stay alert, stay patient and let the market show its hand first. That's how we turn technical analysis into trading profits.


