Technical Analysis: Amazon (AMZN) Upside Target, Downside Mega Move

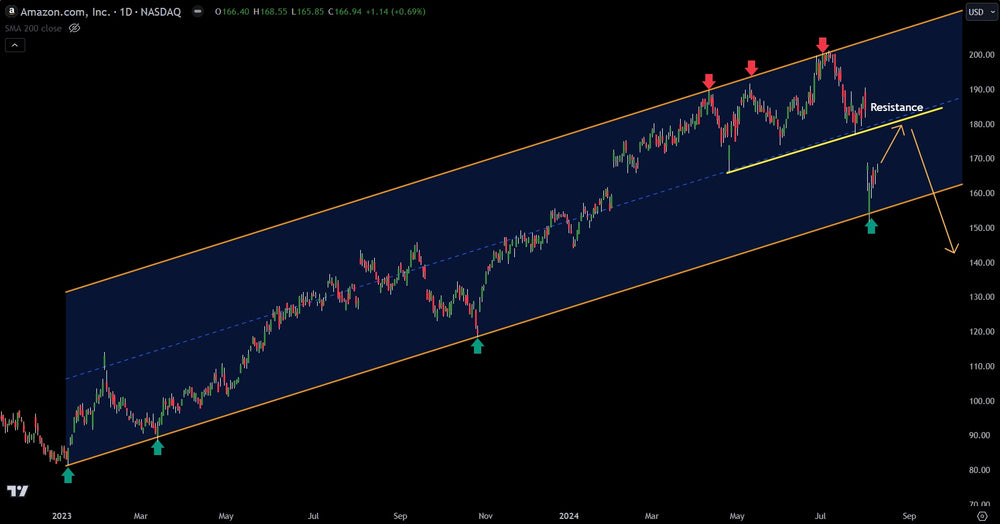
Shares of Amazon.com (AMZN) continue to bounce off a pefect hit of a lower parallel channel line. Take note in the chart how this parallel has worked perfectly for almost two years at predicting the tops and bottoms on Amazon.
However, things are nearing a change. Based on the PPT Methodology that Chief Market Strategist Gareth Soloway teaches, upsloping trend lines eventually break to the downside. In addition, the lower parallel line has hit four times now. The fifth hit has a high probability of breaking.
This means that there is still upside in Amazon.com until the midpoint of the parallel. This happens to be a gap fill as well. Once there, Amazon.com becomes a sell to the lower parallel trend line and likely below.
Learning to trade using charts is liberating. No longer are investors controled by emotion and hope. Probability takes over and decisions become much easier. Verified Investing is here to make that happen for retail investors.
Trading involves substantial risk. All content is for educational purposes only and should not be considered financial advice or recommendations to buy or sell any asset. Read full terms of service.


