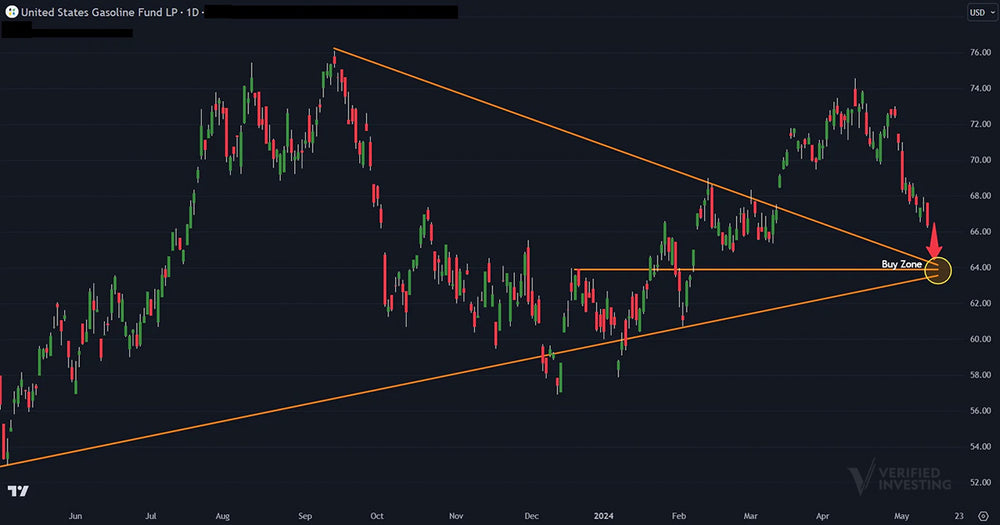
Gasoline Continues To Decline, But Here Is The Chart Buy Zone

The gasoline ETF (UGA) continues to drop sharply as worries over the U.S. economy slowdown. In the last two weeks, GDP, non farm payrolls, jobless claims, ISM data have all come in weaker than expected. With gasoline dropping, it has the potential to slow inflation.
Based on pure technical analysis, there is a chart support/buy zone between $64 and $63.25. This is where multiple trend lines converge. Investors need to understand this is near-term support. This means probabilities favor a bounce for a potential swing trade but it means nothing about a long-term low. In fact, if the economy does spiral into a recession, gasoline longer term could head a lot lower.
Verified Investing helps investors understand probabilities based on data and technical analysis. The key to success is not allowing emotion to control decision making. Social media and mainstream media feed off emotion, triggering investors to do the wrong. Charts and data allow investors to make decisions with probability in their favor.
Trading involves substantial risk. All content is for educational purposes only and should not be considered financial advice or recommendations to buy or sell any asset. Read full terms of service.


