Gold Breaks Out, Here Is The Target Price
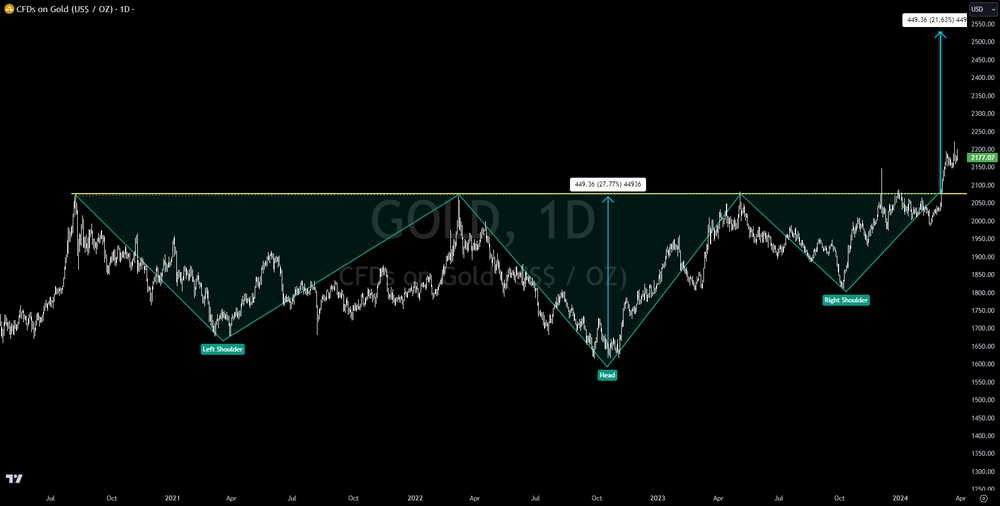
Gold has a broken out of an inverse head and shoulder pattern. Inverse head and shoulder patterns are bullish and the target can be calculated.
Since 2020 gold has hammered on the resistance of $2,075. The pattern formation is crystal clear as seen in the chart above. Note that price has broken out above that level and confirmed.
Once the breakout occurs, investors can take the low of the head to the breakout level. This distance should be replicated as a measured move to the upside target. In the case of gold, the love of the head to the breakout line is $450. Take this $450 and add it to the breakout level of $2,075. This give sa target price of $2,525.
Historically, it takes approximately 12-18 months for gold to achieve its new target. This is seen in past breakouts. If this replicates, the $2,525 target could be seen anywhere between February of 2025 and August of 2025.
Trading involves substantial risk. All content is for educational purposes only and should not be considered financial advice or recommendations to buy or sell any asset. Read full terms of service.


